Customizing Visualizations
Use the Running Reality desktop app or website to create your own videos, and customize how the map looks.
Overview
This short tutorial gives you various options for customizing how Running Reality looks so you can use it as a base map for your own history videos. You want to talk to your audience and followers about a particular time in history and you don't want to have to rebuild a historical map from scratch for each episode. However, you also don't want that standard search box in the middle of your video because your audience can't search in a pre-recorded video.- Get a cleaner look by turning off user interface features, like the search box.
- Eliminate any data that distracts from your narration, like ship tracks.
- Decide between the features in the web and desktop app versions.
- Provide proper citation or provide a link to embed the dynamic map.
Many creators of YouTube, Tik Tok, and other videos use the website version to record quick, simple videos. They love how easy it is so that they can focus on the narrative of history that they want to tell.
Let us know if there are any other features that might help you with video creation. We have been working to add more creator tools and suggestions are welcome. For instance, we recently added the desktop app’s MP4 export with some controls to pre-define date steps and animation frames.
Desktop App vs Web
Each version of Running Reality has different features that might make one better suited to your specific needs.
| Web Version | App Version | |
|---|---|---|
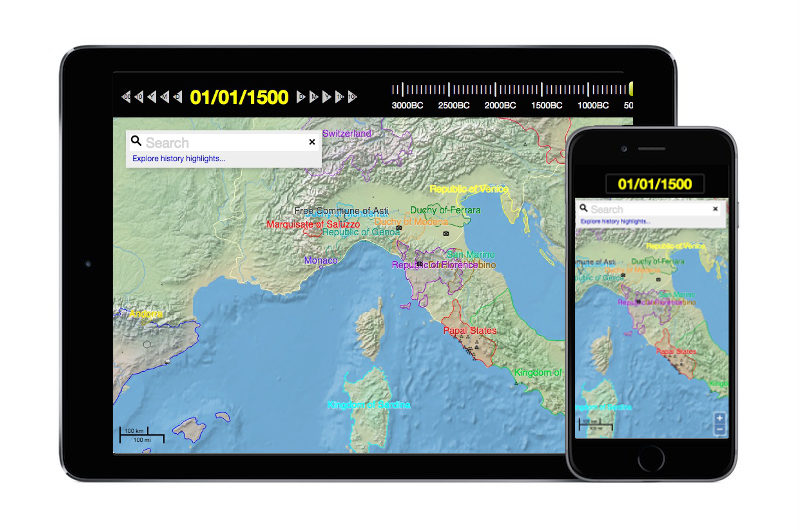 | 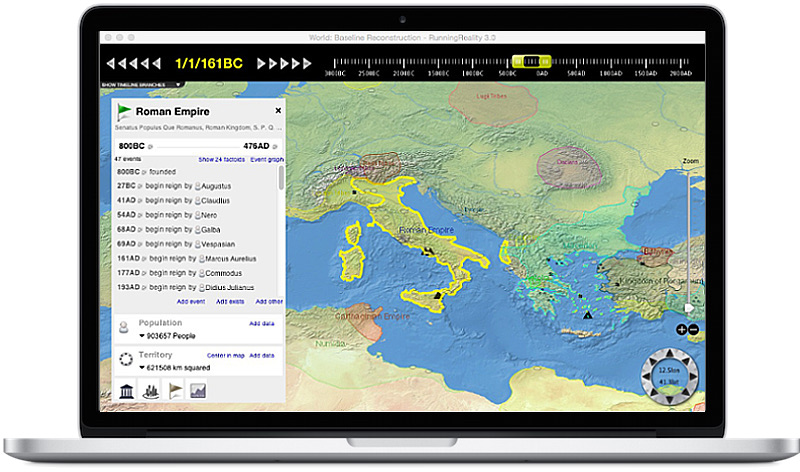 | |
| Model | Downloads in pieces | Entirely Pre-downloaded |
| Embedding | Simple URL | No |
| Export | No | Images, Animated GIF, MP4 movie |
| Turn off UI | Yes | No |
| Turn off data | No | Yes, fine-grained per type |
| Custom overlays | Premium | Yes, wider range of formats |
| Custom borders | No | Yes, fully customize |
| Projection | Mercator | Equi-rectangular |
The Running Reality website downloads data "as needed" which can lead to pauses when you are trying to record a video, depending on your internet connection speed and distance to one of our data centers. If taking a video of the web app, we suggest going through all the date and location steps ahead of recording so that all the data downloads and there aren’t network pauses when you do make the recording. The desktop app pre-downloads all data and loads it into your computer's memory when the app starts. This is slower up front, but leads to much faster date scrolling that's better for recording video.
The Running Reality website uses the Mercator map projection, just like Google Maps, which keeps right angles consistent. Therefore, it is much better for close-in maps where you may see street grids, buildings, or other human-made structures. The desktop app uses an Equirectangular map projection, which is good for more global scale maps. Because historical events happen at a human scale, and are therefore at at street level, we intend to change the desktop app to Mercator in the future.
The desktop app has some export features such as an export to MP4 video that can be loaded into other video editing apps. Also, because it pre-loads everything the desktop app can be a smoother animation. The desktop app also have some features for making object types and labels visible at different zoom levels to emphasize or hide certain things — like turning off art work if making a battle video.
Finally, you can create a blank new GeoJSON file and then use that as a data source layer in the desktop app and into which you can draw arrows or polygons. These annotations can make your video more customized, more repeatable if you need another take, and can save a step of video post-processing.
User Interface Options
Many people use the website version to record quick, simple videos. There are a few simple tricks that you can use to make your videos a bit cleaner. The basic website is for all visitors, so it includes some user interface elements that might be useful for site visitors but are distracting (and inoperable) in a pre-recorded video. Turn those off with a tweak of our URL for a cleaner look.
A basic URL looks like the following, and has all the interface elements shown:
A UI-free URL looks like the following, with URL parameters:
Some suggested parameters for recording a video are:
simpleEquivalent to usingnosocials&nocontrols&nosidebarparameters.nosocialsRemove the social media buttons. These aren't needed for pre-recorded videos.nocontrolsRemove the compass rose and zoom buttons. You can still pan and zoom with the mouse.nosidebarRemove the search bar and don't show the sidebar when clicking objects in the map.
nonationcolorRemoves colors from the borders and labels of nations, provinces, and cultural groups.noadsFor your privacy, remove ads that may reflect your recent internet shopping.nogeoFor your privacy, remove the blue dot marking your device's current location.
More parameters are available to customize the look of embedded maps to better address the specific needs of your visitors and audience to better illustrate your content:
Data Visibility Options
If you are doing a video on battles, maybe you don't want every piece of art or sculpture to appear on the map. Maybe you don't want to have to explain the ship traces and just want a cleaner appearance that focuses on your specific historical topic. Individual types can be made invisible.
Data visibility options are available in the desktop app. The desktop app is a much more powerful tool than the website, and includes a huge number of data editing and visualization features.
To make certain object types invisible, you will open the app's preferences settings and turn off the visibility of the types you don't want. For most creators this could be ships, sculpture, and people, but not geographic features like rivers, bays, or terrain adjustments.
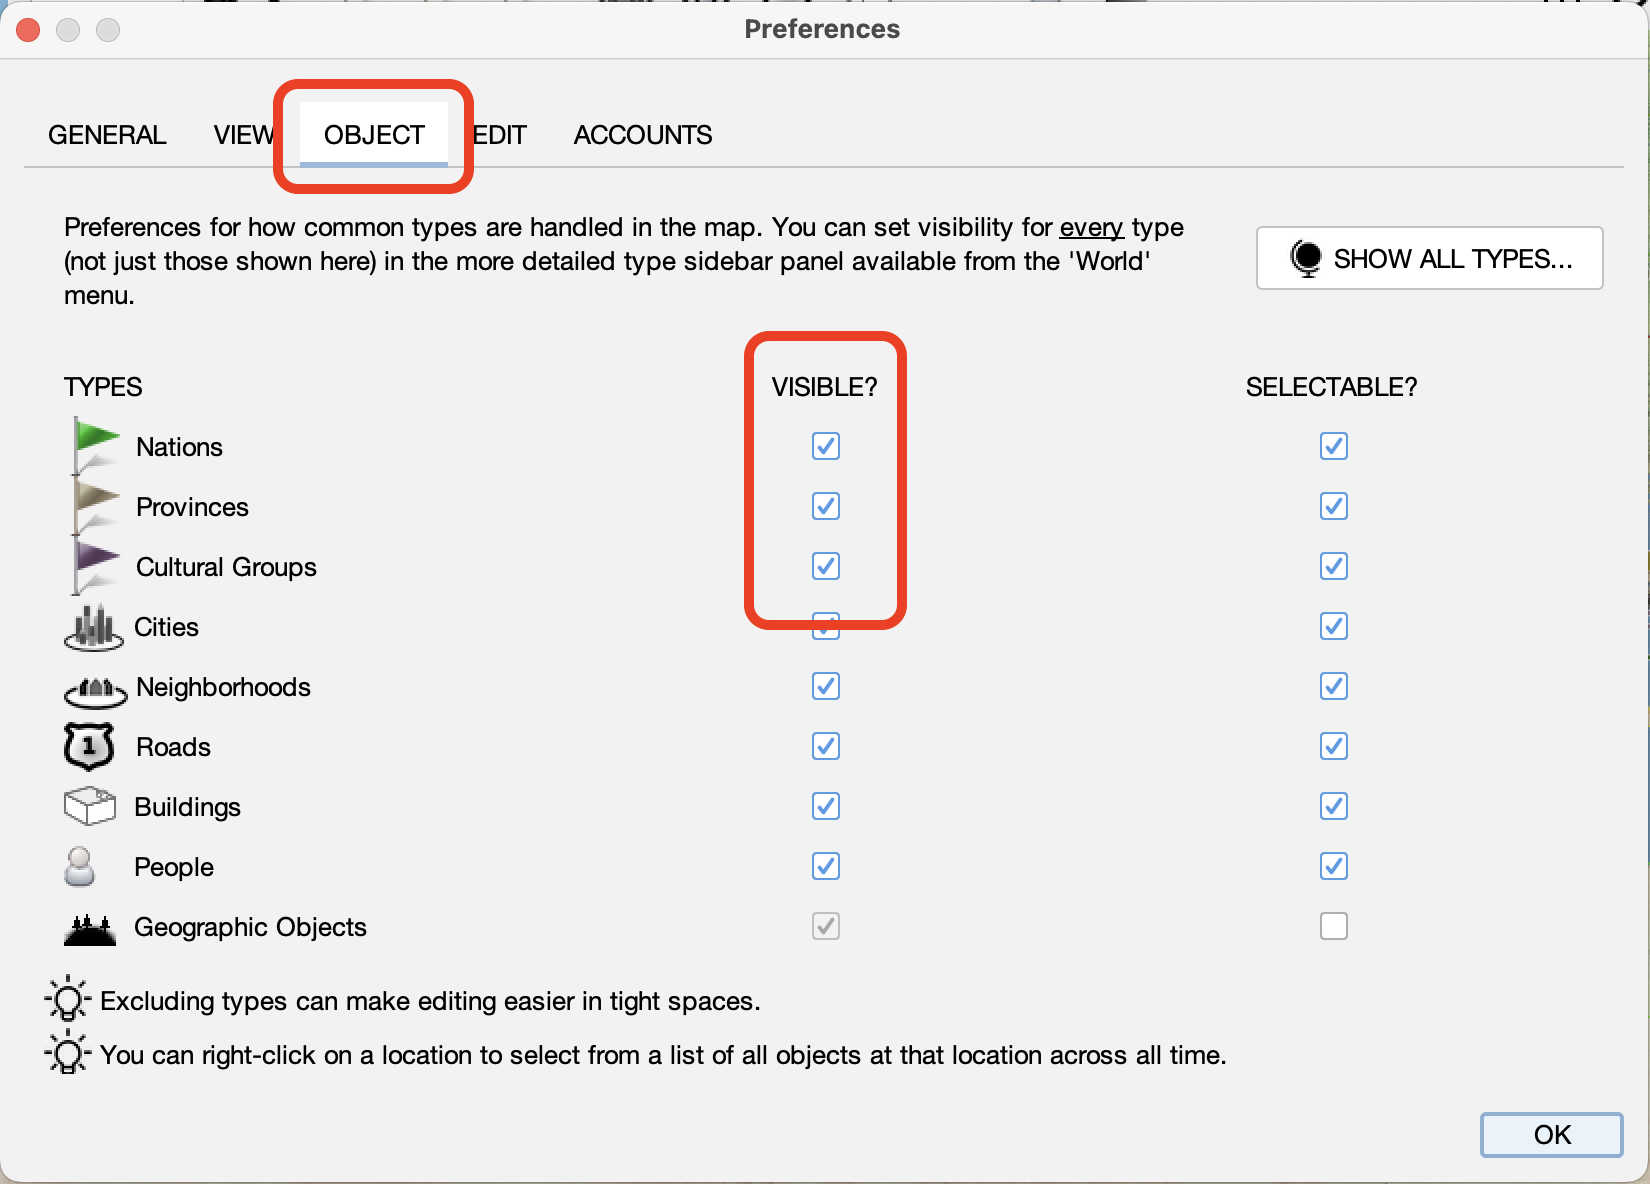
If you want to blank out other types with more precision or to blank out all types, you will use the world data sidebar. If you still have open the preferences panel, you can click "Show All Types." Then, you will see the tree of the full list of types.
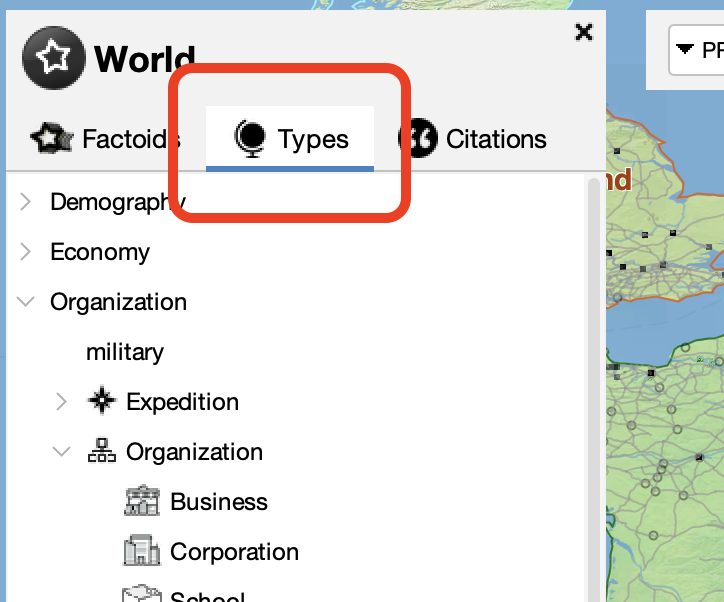
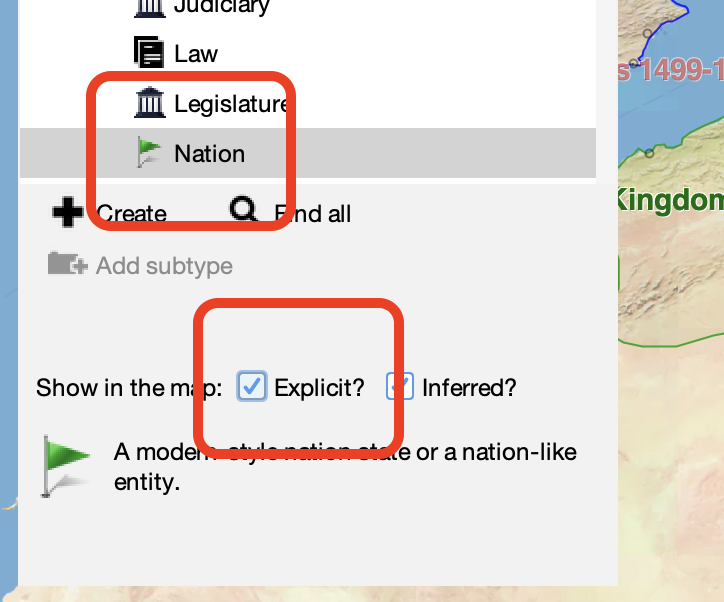
When you select a particular type, check boxes appear at the bottom of the sidebar to control visibility.
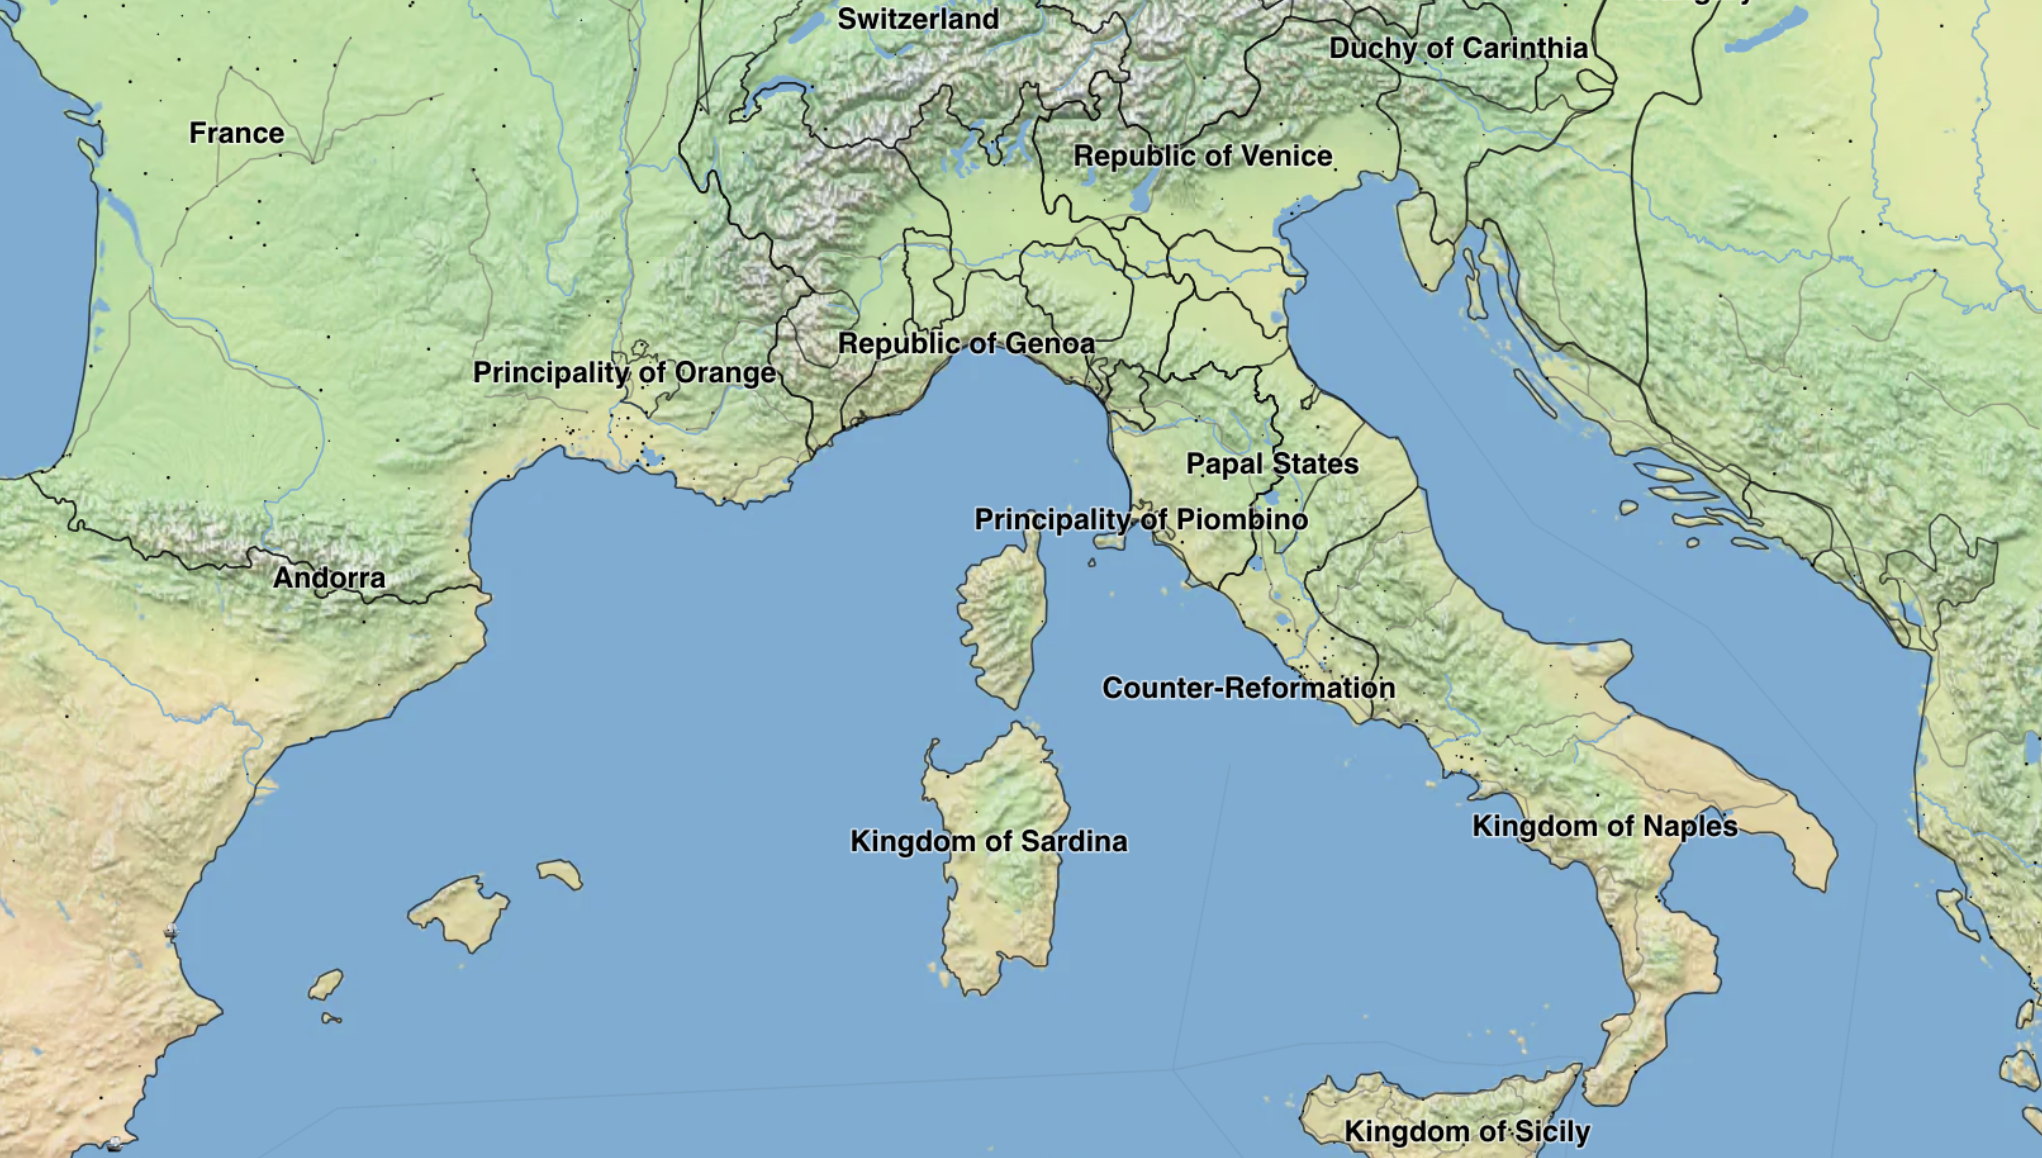
Data Gaps
You can expect there to still be blank areas or bugs in our model of history, so definitely check yourself against the works cited by the model's factoids. We encourage you to see a blank area as an opportunity to contribute data, using our desktop app's tools to help fill in that area. As more data is entered into the model, Running Reality steadily improves the fidelity of how it renders history.
We need your assistance to help our team ensure that the latest developments in historical research can be accessible to our audience. Contributing factoids to the history model will be very valuable to the project and will provide citation links back to you, your primary sources, and research material.
If you have only seen the web version of Running Reality, the desktop app version is the tool for contributing data. The web version is read-only and therefore has a streamlined, simplified history engine. The app version can edit history, work with data sources in a range of formats, do more advanced visualization, cite sources, and submit data to include in the "baseline" timeline.
Citation vs Embedding
If you use Running Reality for your research of directly for your video, we would ask for proper attribution and citation in line with any other cited work.
We have lots of contributors ourselves and we include data from places like Wikipedia and OpenStreetMap that also have many contributors. So, including a link to our site is required and is the way the work of all those contributors can be cited and credited. For specific details, refer to our data use policy:
An alternative is to link to or embed the Running Reality map so that your visitors can access it directly and can find the citations directly themselves. If you like, you can customize the link with the same URL parameters noted above to give people a seamless transition from your video.
Maps are for sharing with all those with an interest in history, including your visitors and audience. You can embed Running Reality maps on your website, using a sharing platform, using a learning management system, or via social media.
Feedback
If you can not find an answer here, or would like to request a feature, please feel free to ask us for help. Send us an email if you would like us to get back to you with a response: