Embedding a Historical Map in a Jupyter Notebook
You can display a historical map in a Jupyter Notebook using the Running Reality website's URL-based page embedding to display any point and time in history. With a Running Reality lesson plan or research account, you can also add custom overlays.
Overview
Jupyter Notebooks are important for analysis due to their support for interactive computing, code documentation, data visualization, versatility with multiple programming languages, reproducibility, collaboration, and their role in education and learning. These features contribute to making the analysis process more efficient, transparent, and accessible.
Running Reality maps can be embedded in a wide range of other websites, including Jupyter Notebooks. This makes historical maps available in Notebooks as either a basic static map or a dynamic, interactive map that connects to the Notebook data.
Basic Embedding
Basic embedding of a static map lets you show a historical place and time in your Notebook for reference or context. You can construct a URL with URL parameters as part of the Python string.
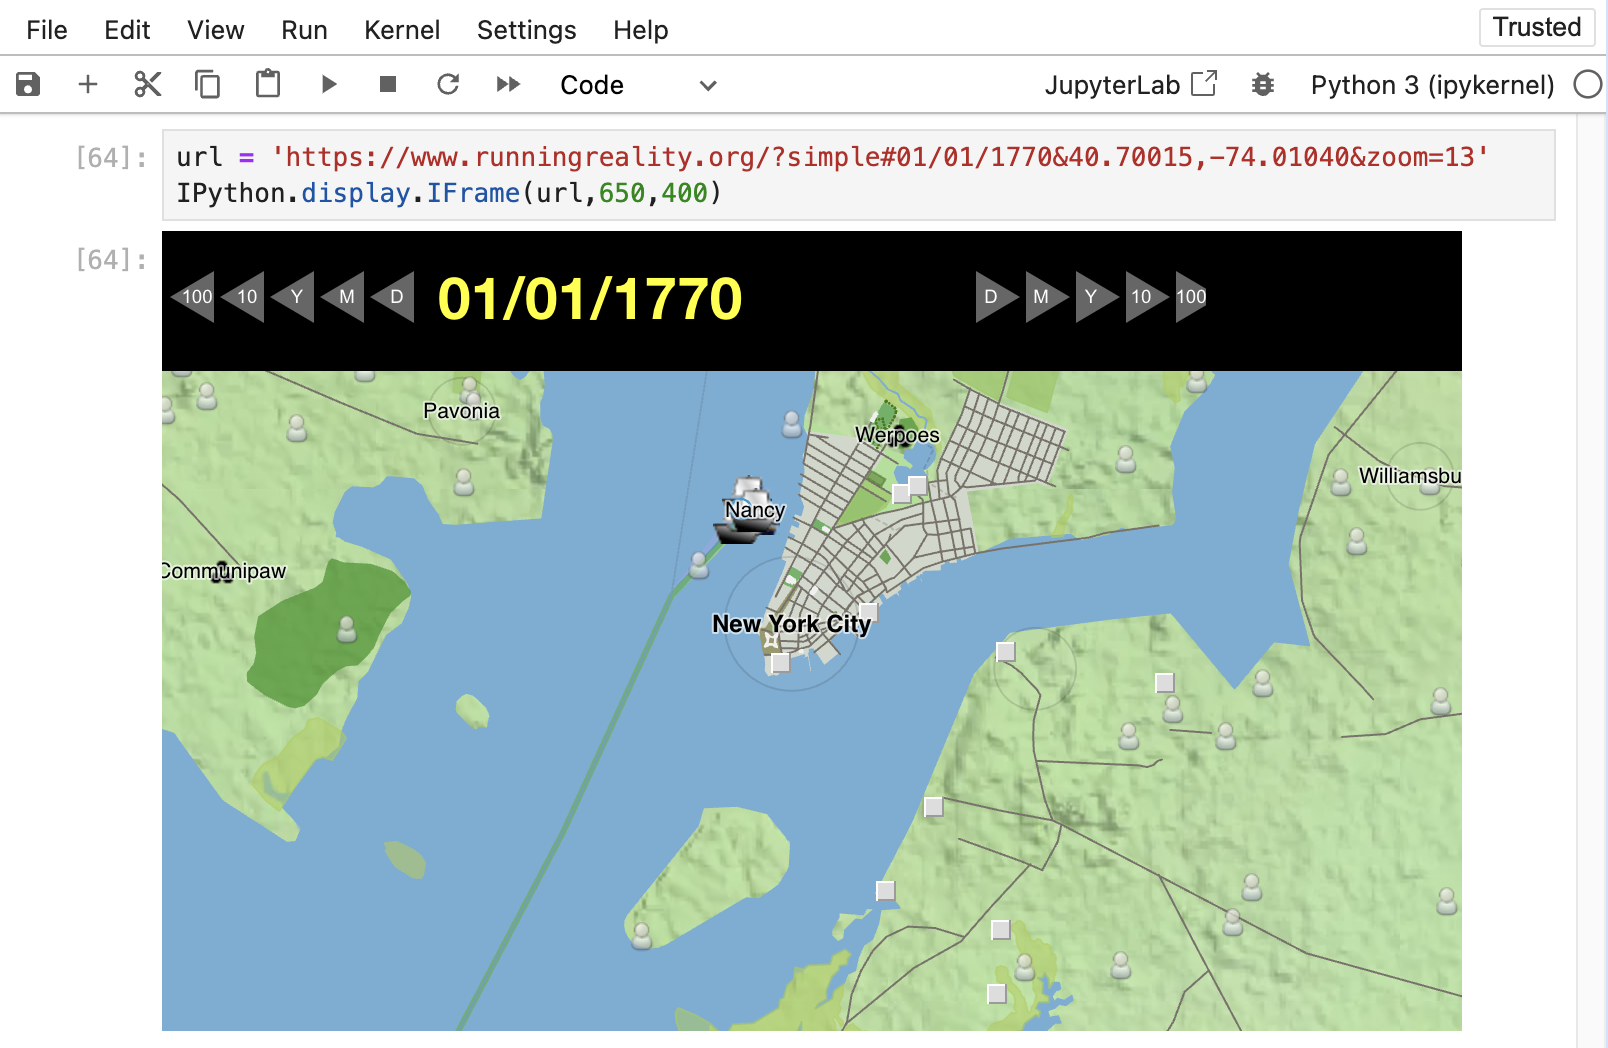
import IPython

url = 'https://www.runningreality.org/?simple#01/01/1770&40.70015,-74.01040&zoom=13'

IPython.display.IFrame(url,600,400)
The full list of URL parameters that you can use to control the look and data within a map can be found here:
Interactive Maps
Embedding a map within a Notebook can also be made interactive, where the map responds dynamically to the data within the Notebook or to interactive Notebook controls. Here is an example that shows how to link an interactive slider to the map's zoom parameter. This is a simple example, and you could have just used the map's own zoom controls, but it shows how to use Python variables to construct the URL. The map will then update as the slider is moved.
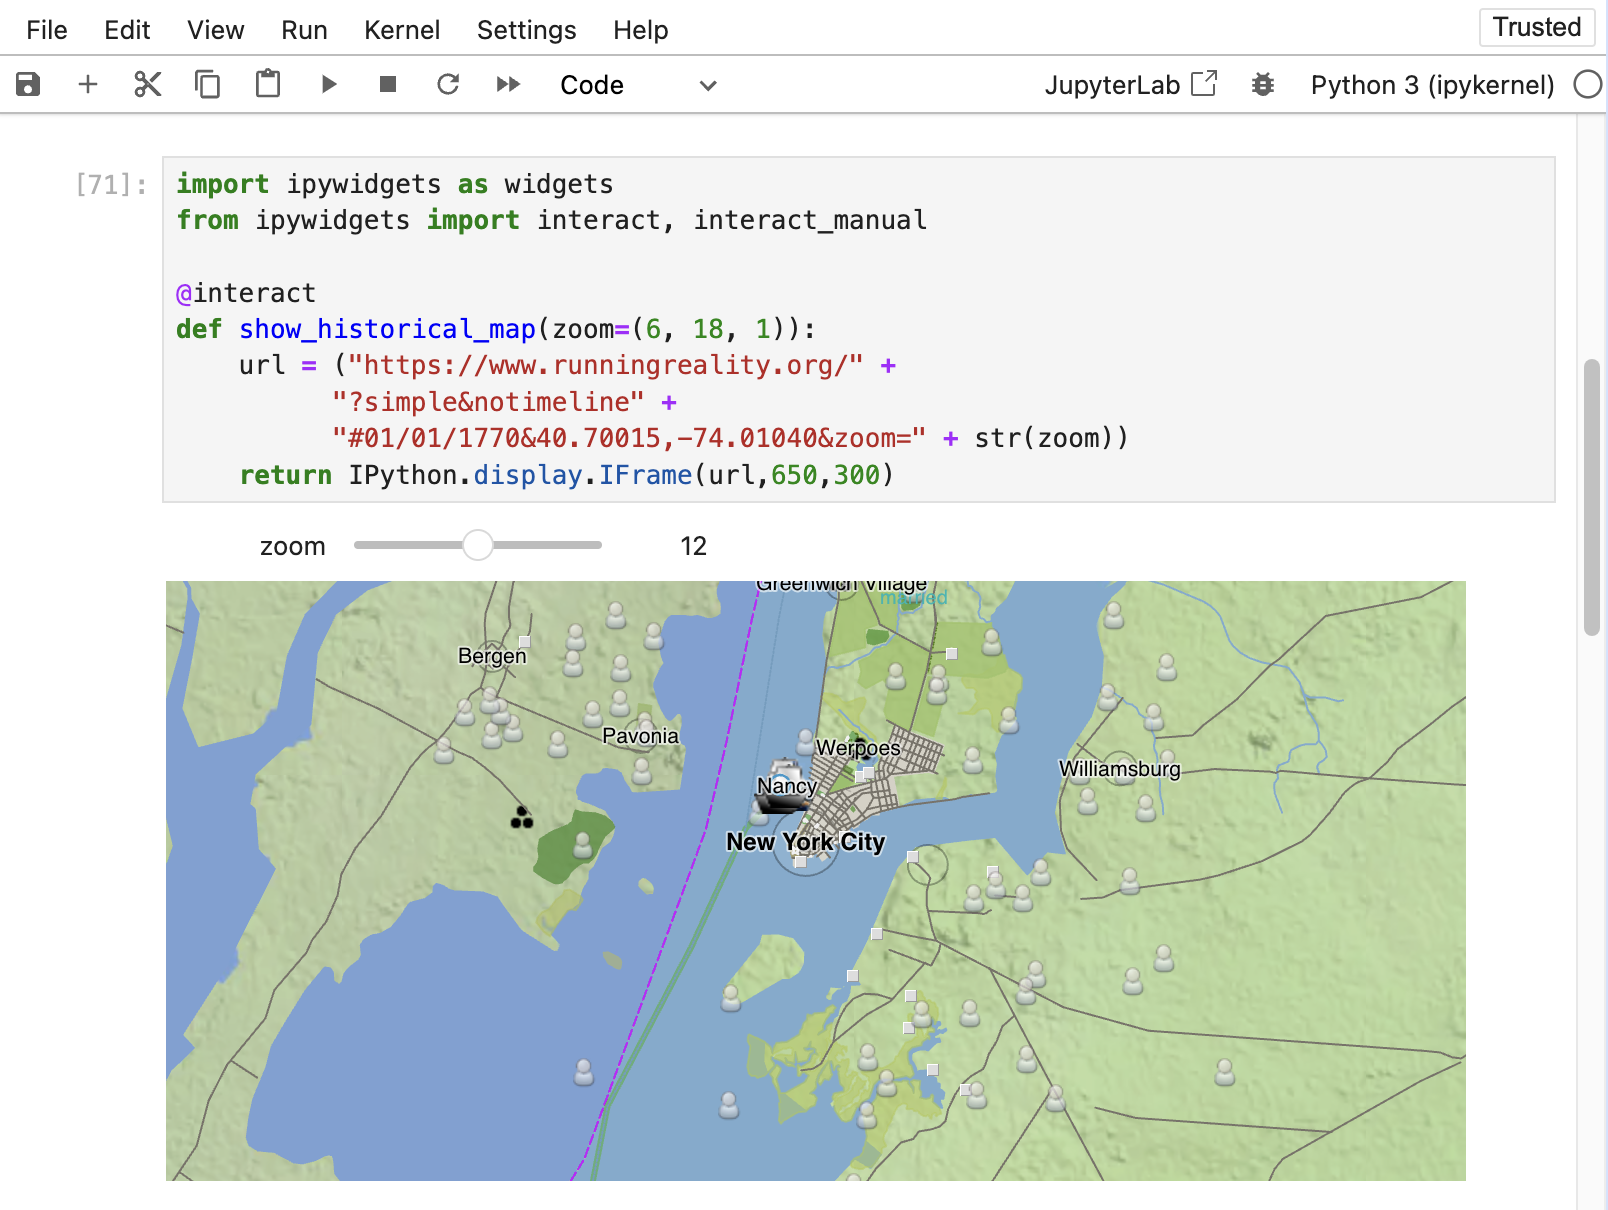
import ipywidgets as widgets
from ipywidgets import interact, interact_manual
@interact
def show_historical_map(zoom=(6, 18, 1)):
url = ("https://www.runningreality.org/" +
"?simple¬imeline" +
"#01/01/1770&40.70015,-74.01040&zoom=" + str(zoom))
return IPython.display.IFrame(url,650,300)
Overlays
Currently, you can only show an overlay on a Running Reality map using a Lesson Plan or hosted Research. This allows you to add markers or layers to your map via the editor on the Running Reality Projects page. Running Reality requires that you be signed in and identified so that you can show overlay data with proper traceability back to your account.
You can show overlays on a Running Reality map in an HTML page hosted from your own server using JavaScript.
Coming soon Running Reality will allow you to use data URLs to add your own GeoJSON overlays directly from your Jupyter Notebook to the map. The GeoJSON file can contain your layer data and must be created and hosted within the Notebook itself and can only be made public within your published notebook.
Feedback
If you can not find an answer here, or would like to request a feature, please feel free to ask us for help. Send us an email if you would like us to get back to you with a response: