Working with Data in Running Reality
The Running Reality desktop app can work with data from a range of data sources so you can perform text, structured data, and geotemporal analyses.
Overview
Running Reality can work data from a range of digital history data sources, in their native format. You can view the data, perform a number of analyses on that data, view the data, or convert it from one type to another. Depending on the source, it can display it as a layer over top of the world map, or it can convert it to history data that is incorporated into the world model, thereby adjusting the map. Data sources can be geospatial or geotemporal, but they do not have to be. A data source can be a PDF of an article about a relevant topic.
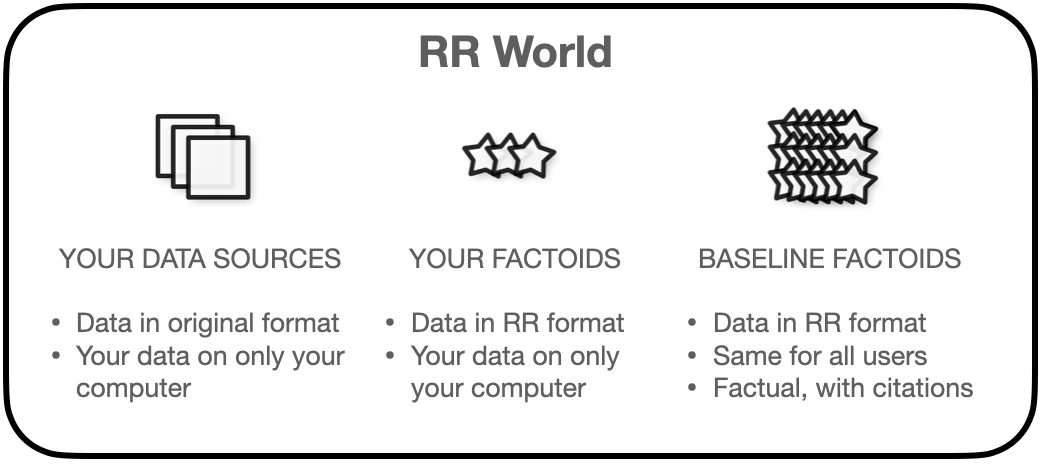
You add data sources to worlds. A world is a working file which contains your data on your local computer. If you are familiar with GIS applications, this is the equivalent of a project file which contains layers and data. Also, you can have worlds with different data sources attached each with different settings for different projects. A data source is shown on top of the map, where factoid data alters the world model shown in the map. In other words, a data source can place a symbol over top of a city, but a factoid can change the founding date and population of a city.
 Download App
Data Sources
Data sources can contain a wide range of data, in a range of file formats. They open in the Running Reality app directly and many of them can be edited directly within the Running Reality app. Note that there is currently no undo function in the app.
GIS Why do we use the term "data sources" instead of "layers?" For users familiar with GIS systems, you are probably used to everything being a layer because all GIS data is geospatial. However, Running Reality is a history app, so it works with data that is geospatial, geotemporal, or with historical narrative. There are also many kinds of structured historical data that may not (yet) have a geographic component, such as relationship data (genealogical or other), epigraphic data, or cultural data. Research papers, usually a PDF, are also used extensively in historical mapping projects, either for reference or for creating geographical data. So, we use the term "data sources" to cover all this data whether it can be used as a layer or not.
| Type | Format |
|---|---|
| Text File | TXT, PDF, TEI, EpiDOC, GEDCOM |
| Table Files | XLS, XLSX, CSV, Google Sheets (experimental) |
| GIS File | GeoJSON, GeoJSON-T, GeoJSON-LD |
| Image File | PNG, JPG, TIFF, GeoTIFF |
| Linked / Structured Data | XML, RDF, TTL |
| Map Server | XYZ Tile Server (Google Maps, Open Street Map, etc), WMS Server |
| Database | MySQL |
| Online Repository | GitHub, USGS, etc |
| Web Page | Wikipedia |
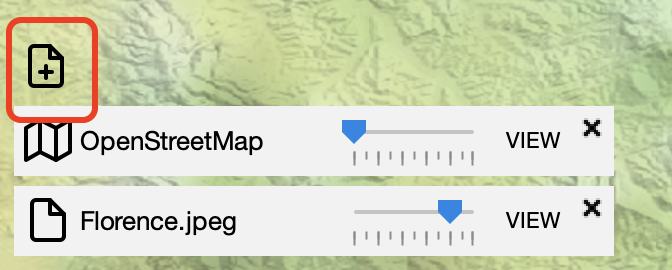
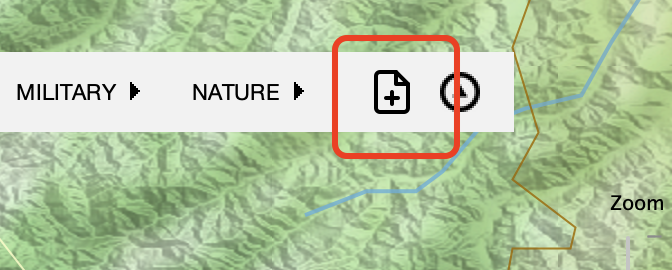
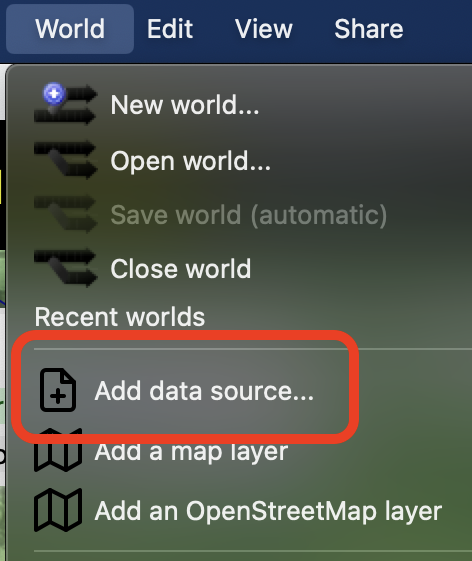
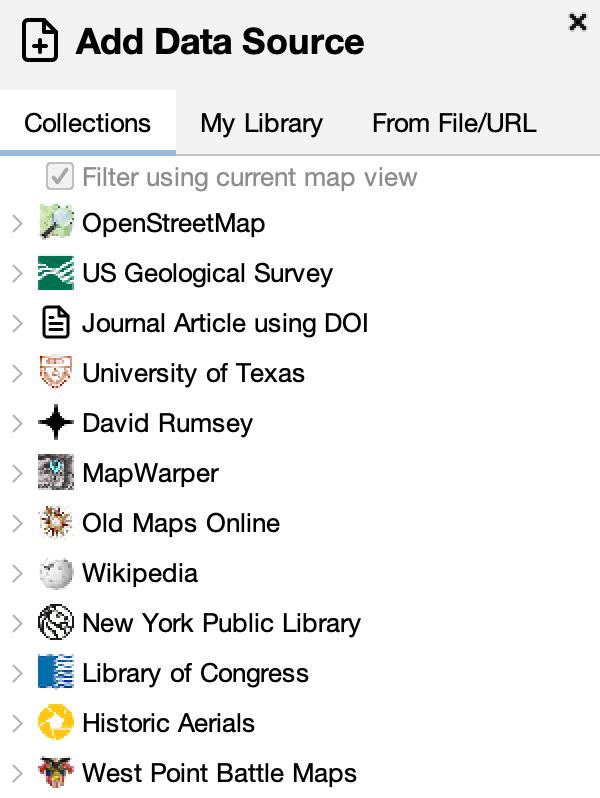
You can add a data source from any one of three redundant locations in the interface. If you prefer a keyboard option, you can use command-D (MacOS) or control-D (Windows). These will all open the Add Data Source selector.
The Add Data Source selector allows you to select a source image or file from an online collection, from your library of working sources, or from a new file on your computer or on the internet. The collections can contain direct links to maps within those collections, for the particular spot on the globe you are viewing, already georectified. They may also have general links to the map collection pages for non-georectified maps. The My Library tab includes sources you have previously pinned here, sources you have recently used, and sources associated with projects you are actively following. The file tab lets you select a file from your computer, from a URL pointing to a file on the Internet, or from the clipboard on your computer.
There are additional ways to create image map data sources:
- Copy/Paste: Create an image data source by copying an image in another app, like a web browser, then paste it in Running Reality.
- PDF: Extract an image from a PDF as a new standalone (and georectifiable) image data source. Ideal for maps in research papers. If the paper has a DOI, then the image inherits the citation.
Creating a data source from an image on the clipboard can be a convenient way to turn a historical map from a web page into a map layer. First copy the image to your clipboard, then create a new data source from the clipboard. Additionally, if you are using a PDF of an article as a data source, you can make any image in the PDF -- in particular map images -- into a new data source map layer.
More detail is available about the file formats recognized by Running Reality and about various online historical maps and map collections:
Linked Open Data
Linked open data (LOD) is an important concept for the future of digital history research. The Pelagios Network, in particular, emphasizes the importance of being able to crosswalk data from different digital history projects to each other using common reference identifiers as the links. Further, they have been working to develop ways to link historical documents to new digital history tools like Running Reality.
Data sources enable interoperability between different file formats and include integrations with major LOD tools. For instance, the RDF file format is output from many LOD-compatible data stores, such as the coin database Nomisma.org, and opening an RDF file lets you display the data in the map, transform it into Running Reality factoids, analyze it using a geocoder, or output it as a GeoJSON layer to use in a GIS app.
Further, our prototype system to use machine learning to extract structured data from narrative data sources, like a PDF, TXT, or HTML file, will allow more data to become LOD.
Editing
To edit a data source, first switch it to "edit" mode. By default, data sources are opened in a "view only" mode. This is to prevent unintentional edits or changes. Note that Running Reality does not have an undo system at this time.
Learn about georectifying historical maps and identifying features on them:
Data Transformation
Running Reality has a data transformer built with feedback from researchers. It is enhanced to work within digital history tool workflows, with structured and unstructured data, and with geospatial, geo-temporal and narrative data. A data layout tells Running Reality what type of data is in the data source. Without a layout, it would not know which data columns or properties represent dates, names, locations, events, or relationships.
Running Reality can sometimes suggest a data layout if it finds a date column, but you will have to confirm the historical context. If Running Reality can auto-detect that a column is a date, is that the date of the founding of a city, a birth date, the citation publication date, or another date? Many data sources have location data that is a named location (such as a ship's port of origin), or linked data (such as a geocoder reference ID).
To have this data source appear as a map layer, a minimal layout that identifies the location data is all that is needed. If start and end dates and a name are identified by the data layout, then the map layer can have additional nuance.
Analysis
Running Reality is adding analysis tools to the app to be able to perform GIS-style and text analysis on data sources.
GIS-style analyses operate on geotemporal data points. These can create a new derived data set from an existing one, test hypotheses, or prepare data for visualization. One of the first such analyses is to filter data then draw a polygon to show the extent of it. This has research applications where you can show the spread of a particular property within a larger group over time.
Text analyses operate on text documents like TXT, HTML, EpiDoc, or PDF that contain unstructured data. One of the first such analyses is to identify proper names within text and match those to places to generate geospatial data from the text.
Viewing as a Map Layer
Data which contains geospatial data or geotemporal data can be shown as a layer in the map. As mentioned above, a data layout may be required for some types to identify the data fields within the data source that represent latitude, longitude, or a named place.
Narrative can be shown on the map as well, using a data layout to identify named locations by geocoding. More advanced is to use an AI Large Language Model (LLM) to identify locations mentioned using natural language, such as "Julius Caesar then returned to the fort."
| Immediate | Map images and GIS files have embedded location data to immediately become a layer. | GeoJSON, PNG, JPEG, TIFF |
| After Data Layout | Spreadsheets could have geographic or temporal data, but the columns with that data must be identified first. | XLS, XLSX, CSV |
| After Analysis | Text files might have named locations that can be turned into a layer by geocoding. | TXT, PDF, TEI, EpiDOC, GEDCOM |
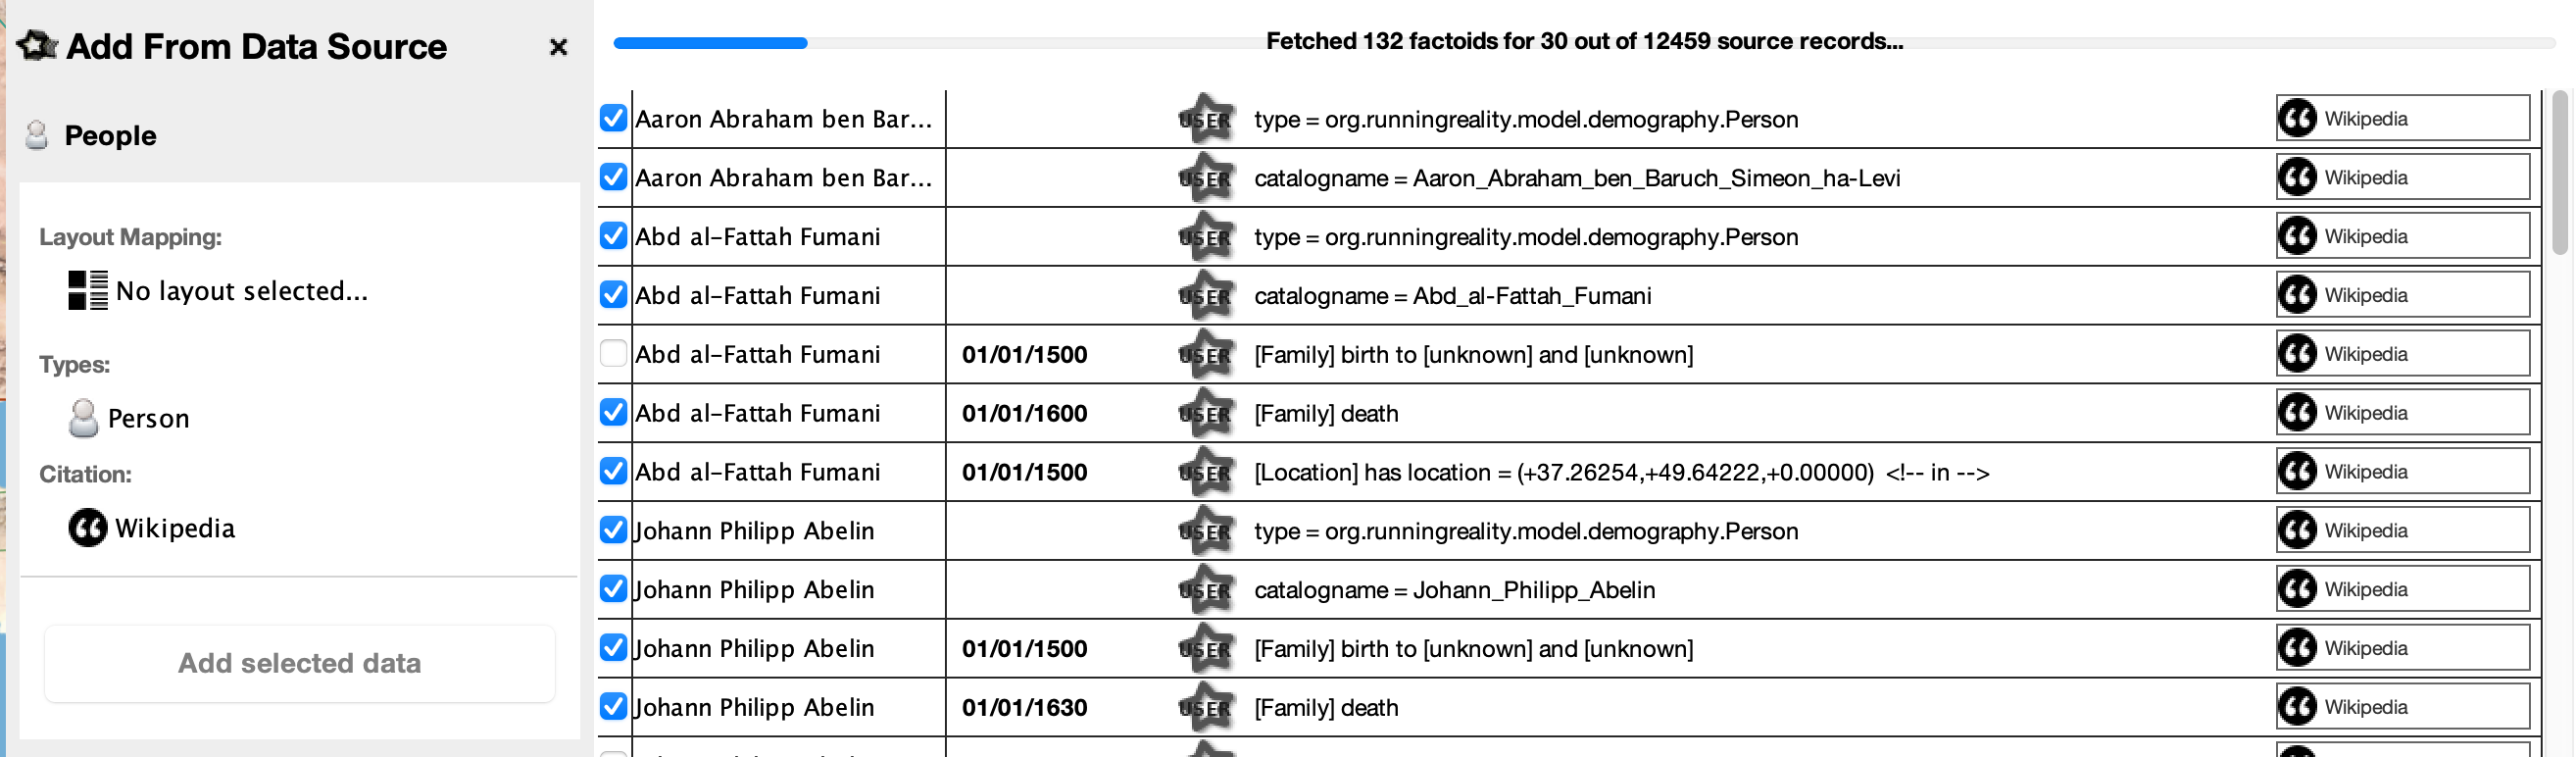
Import to Factoids
If a source can be imported to factoids, it will have an "import factoid" button in its sidebar view. Further configuration may be needed to set the citation or the data layout. While only a few data fields may be needed for viewing a data source as a map layer, a much richer set of data layout options might make a wide range of factoids possible.
Data can be import to factoids or left in the native data source format. There are different considerations for each approach, depending on your goals for the data and the degree of integration and control you would like.
| Data Source | Import | |
|---|---|---|
| Consideration |
|
|
| Data format | Format remains that of the source file | Use Running Reality's native Factoid history data format |
| Data ownership | Ownership remains with you | Ownership remains with you |
| Data integration | Data shown on top of history | Data can change underlying history model |
Metadata
Some metadata may be set for a data source. This metadata is kept in the RR World file, and does not change or edit the underlying data source file. The metadata can include pinning, which pins a data source to a world so that it can not be accidentally removed (unless unpinned first). A date can also be set for the data source, to indicate the date of the source data. This can be useful for PDFs or historical maps so that you can quickly move the main timeline to the date of the data or map.