Filtering and Analyzing a Data Source
The Running Reality desktop app can view a range of geographic and non-geographic data sources, perform simple filtering, and then analyze the filtered data.
Overview
This short tutorial steps through the basic procedures to open a data source, filter the data, then create an analysis of that data in a new data source. This allows you to take a set of data that may have geotemporal parameters and generate a GeoJSON file of select results you can load into another application or post to the web.
Download AppFiltering
The data within data sources can be filtered to narrow the data records that are shown in a map layer, shown in the sidebar, and used for downstream analysis. The filter criteria use a simple matching on a property, column, or field.
We are going to use a GeoJSON file from GreekCoinage.org that lists all coin mints in the classical Mediterranean world. We could have used a file of a different format as well, such as an RDF file. The file is here if you would like to download a copy yourself:
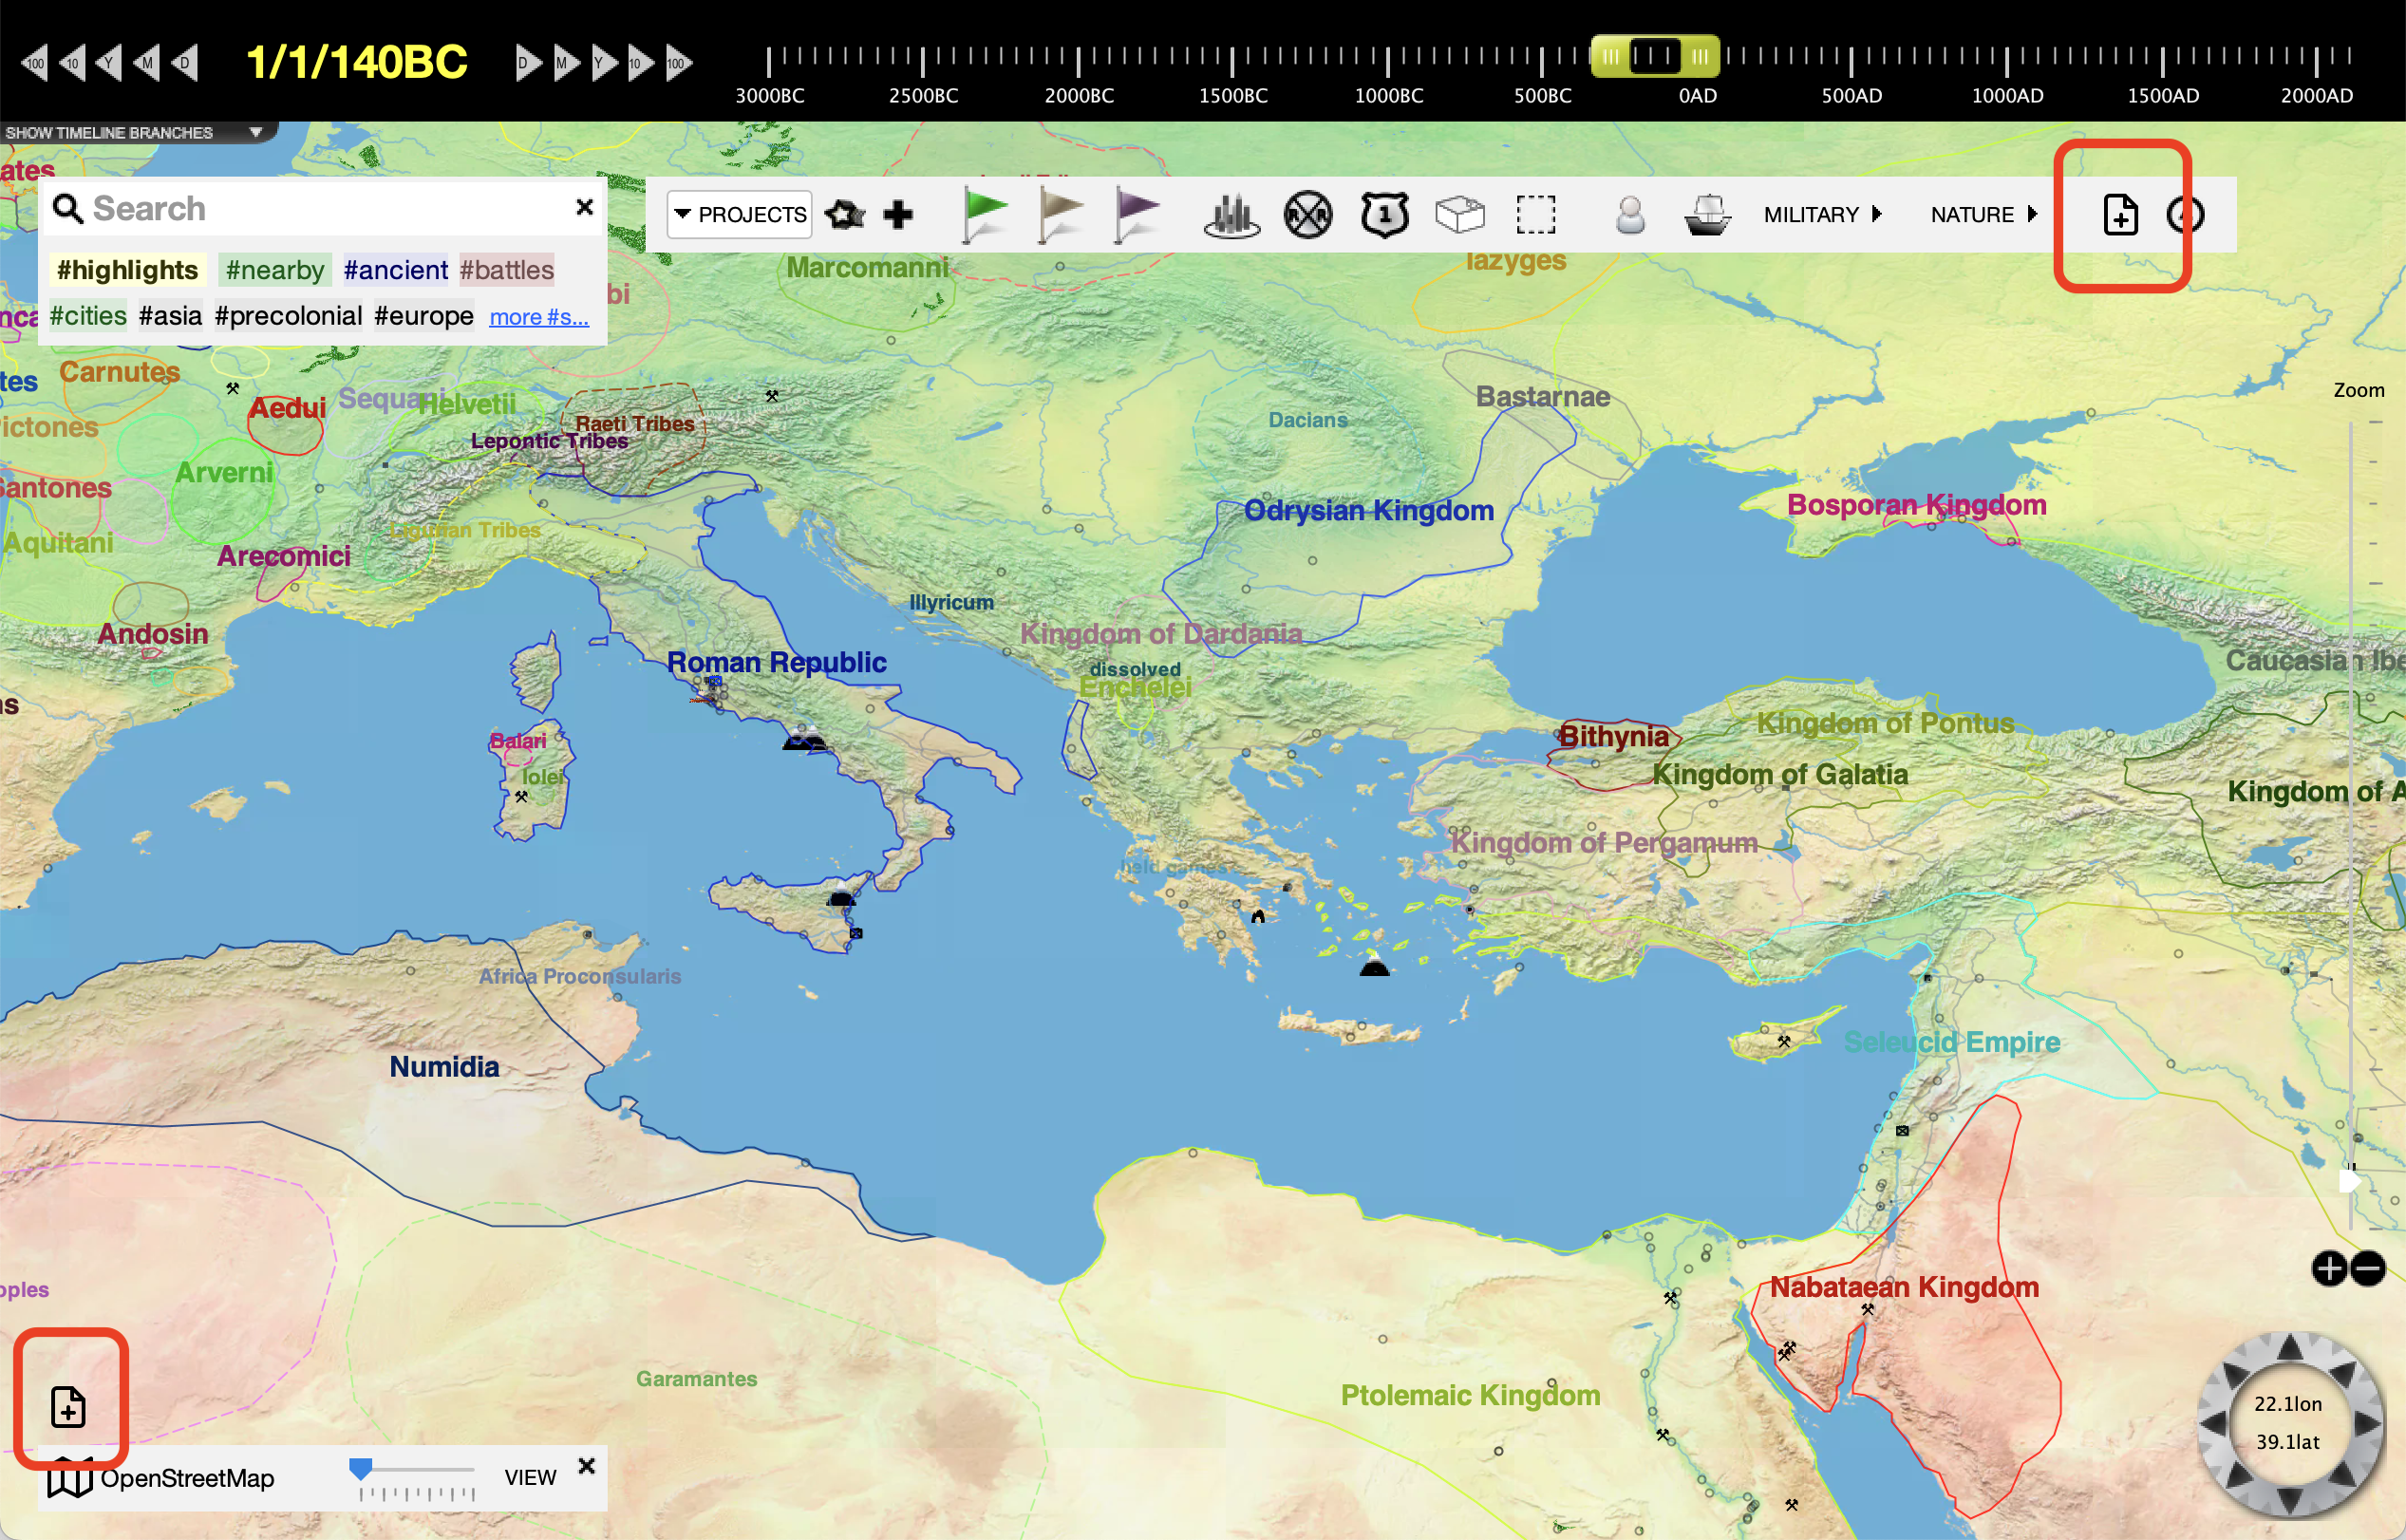
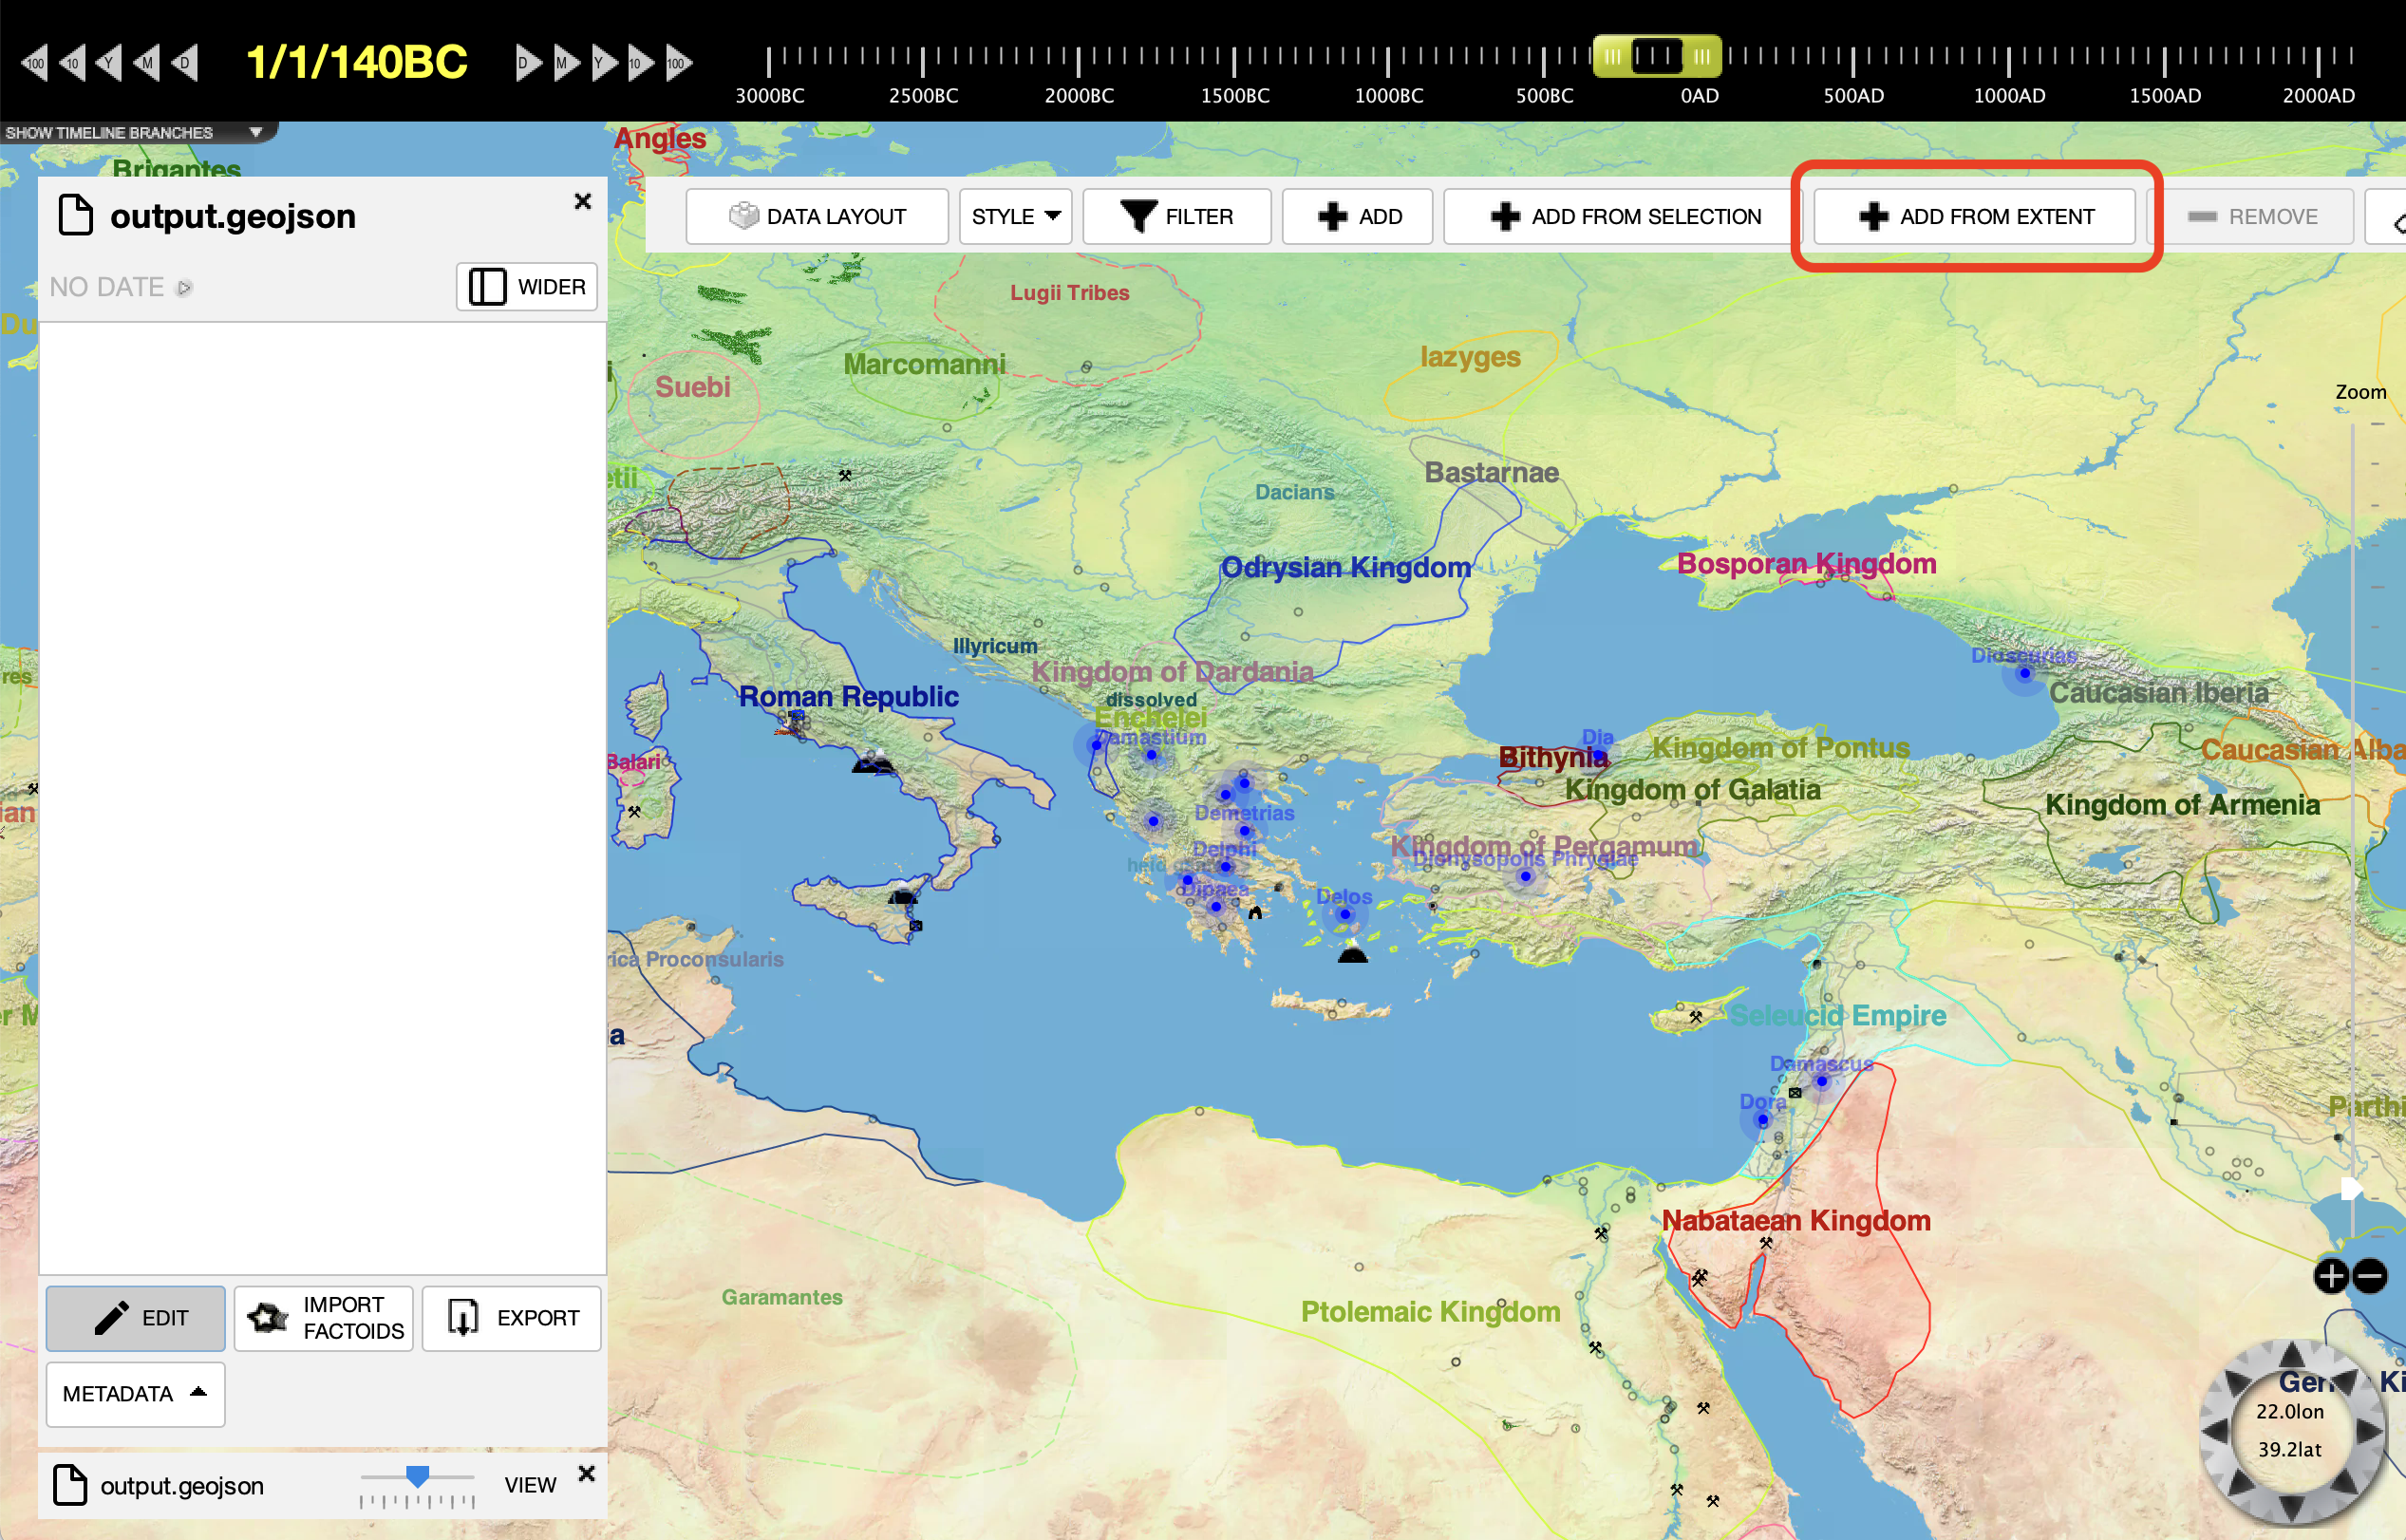
mints.geojsonTo add a new data source, click one of the two "add" buttons in the picture below. Note that you must be in an editable world, which corresponds to a world file that saves your data source preferences.
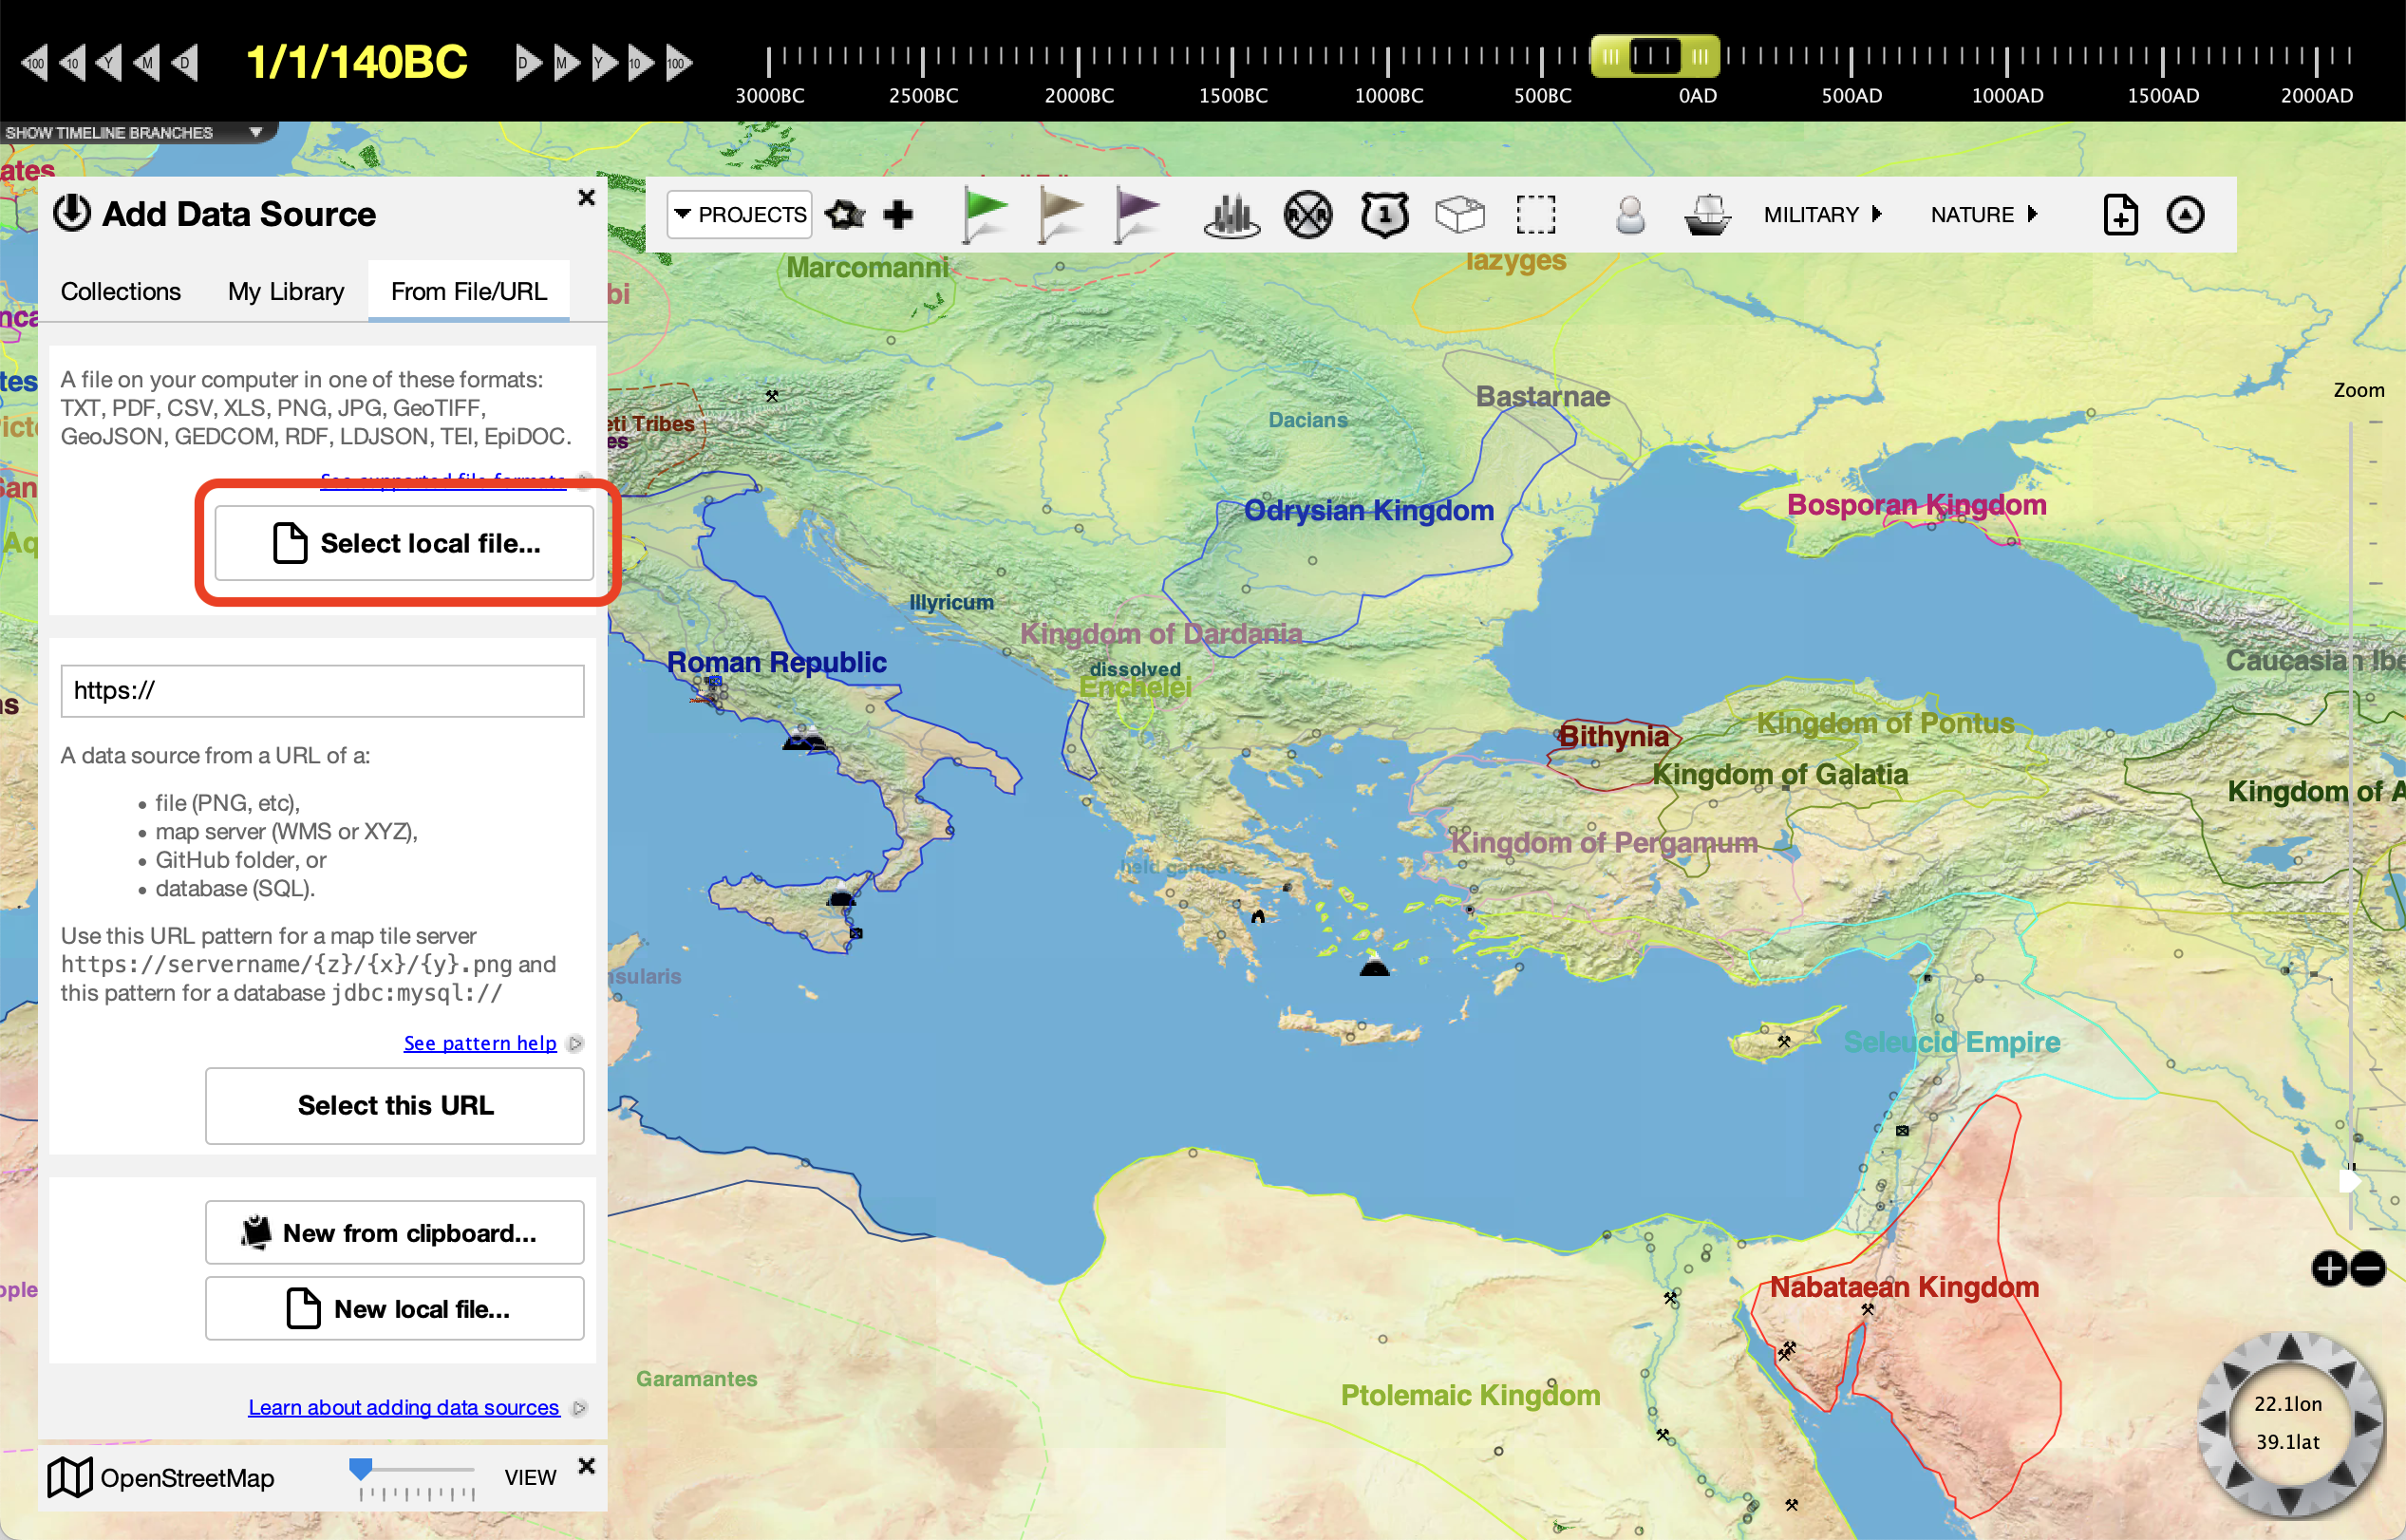
Then, chose "select local file" and the mints.geojson file you downloaded.
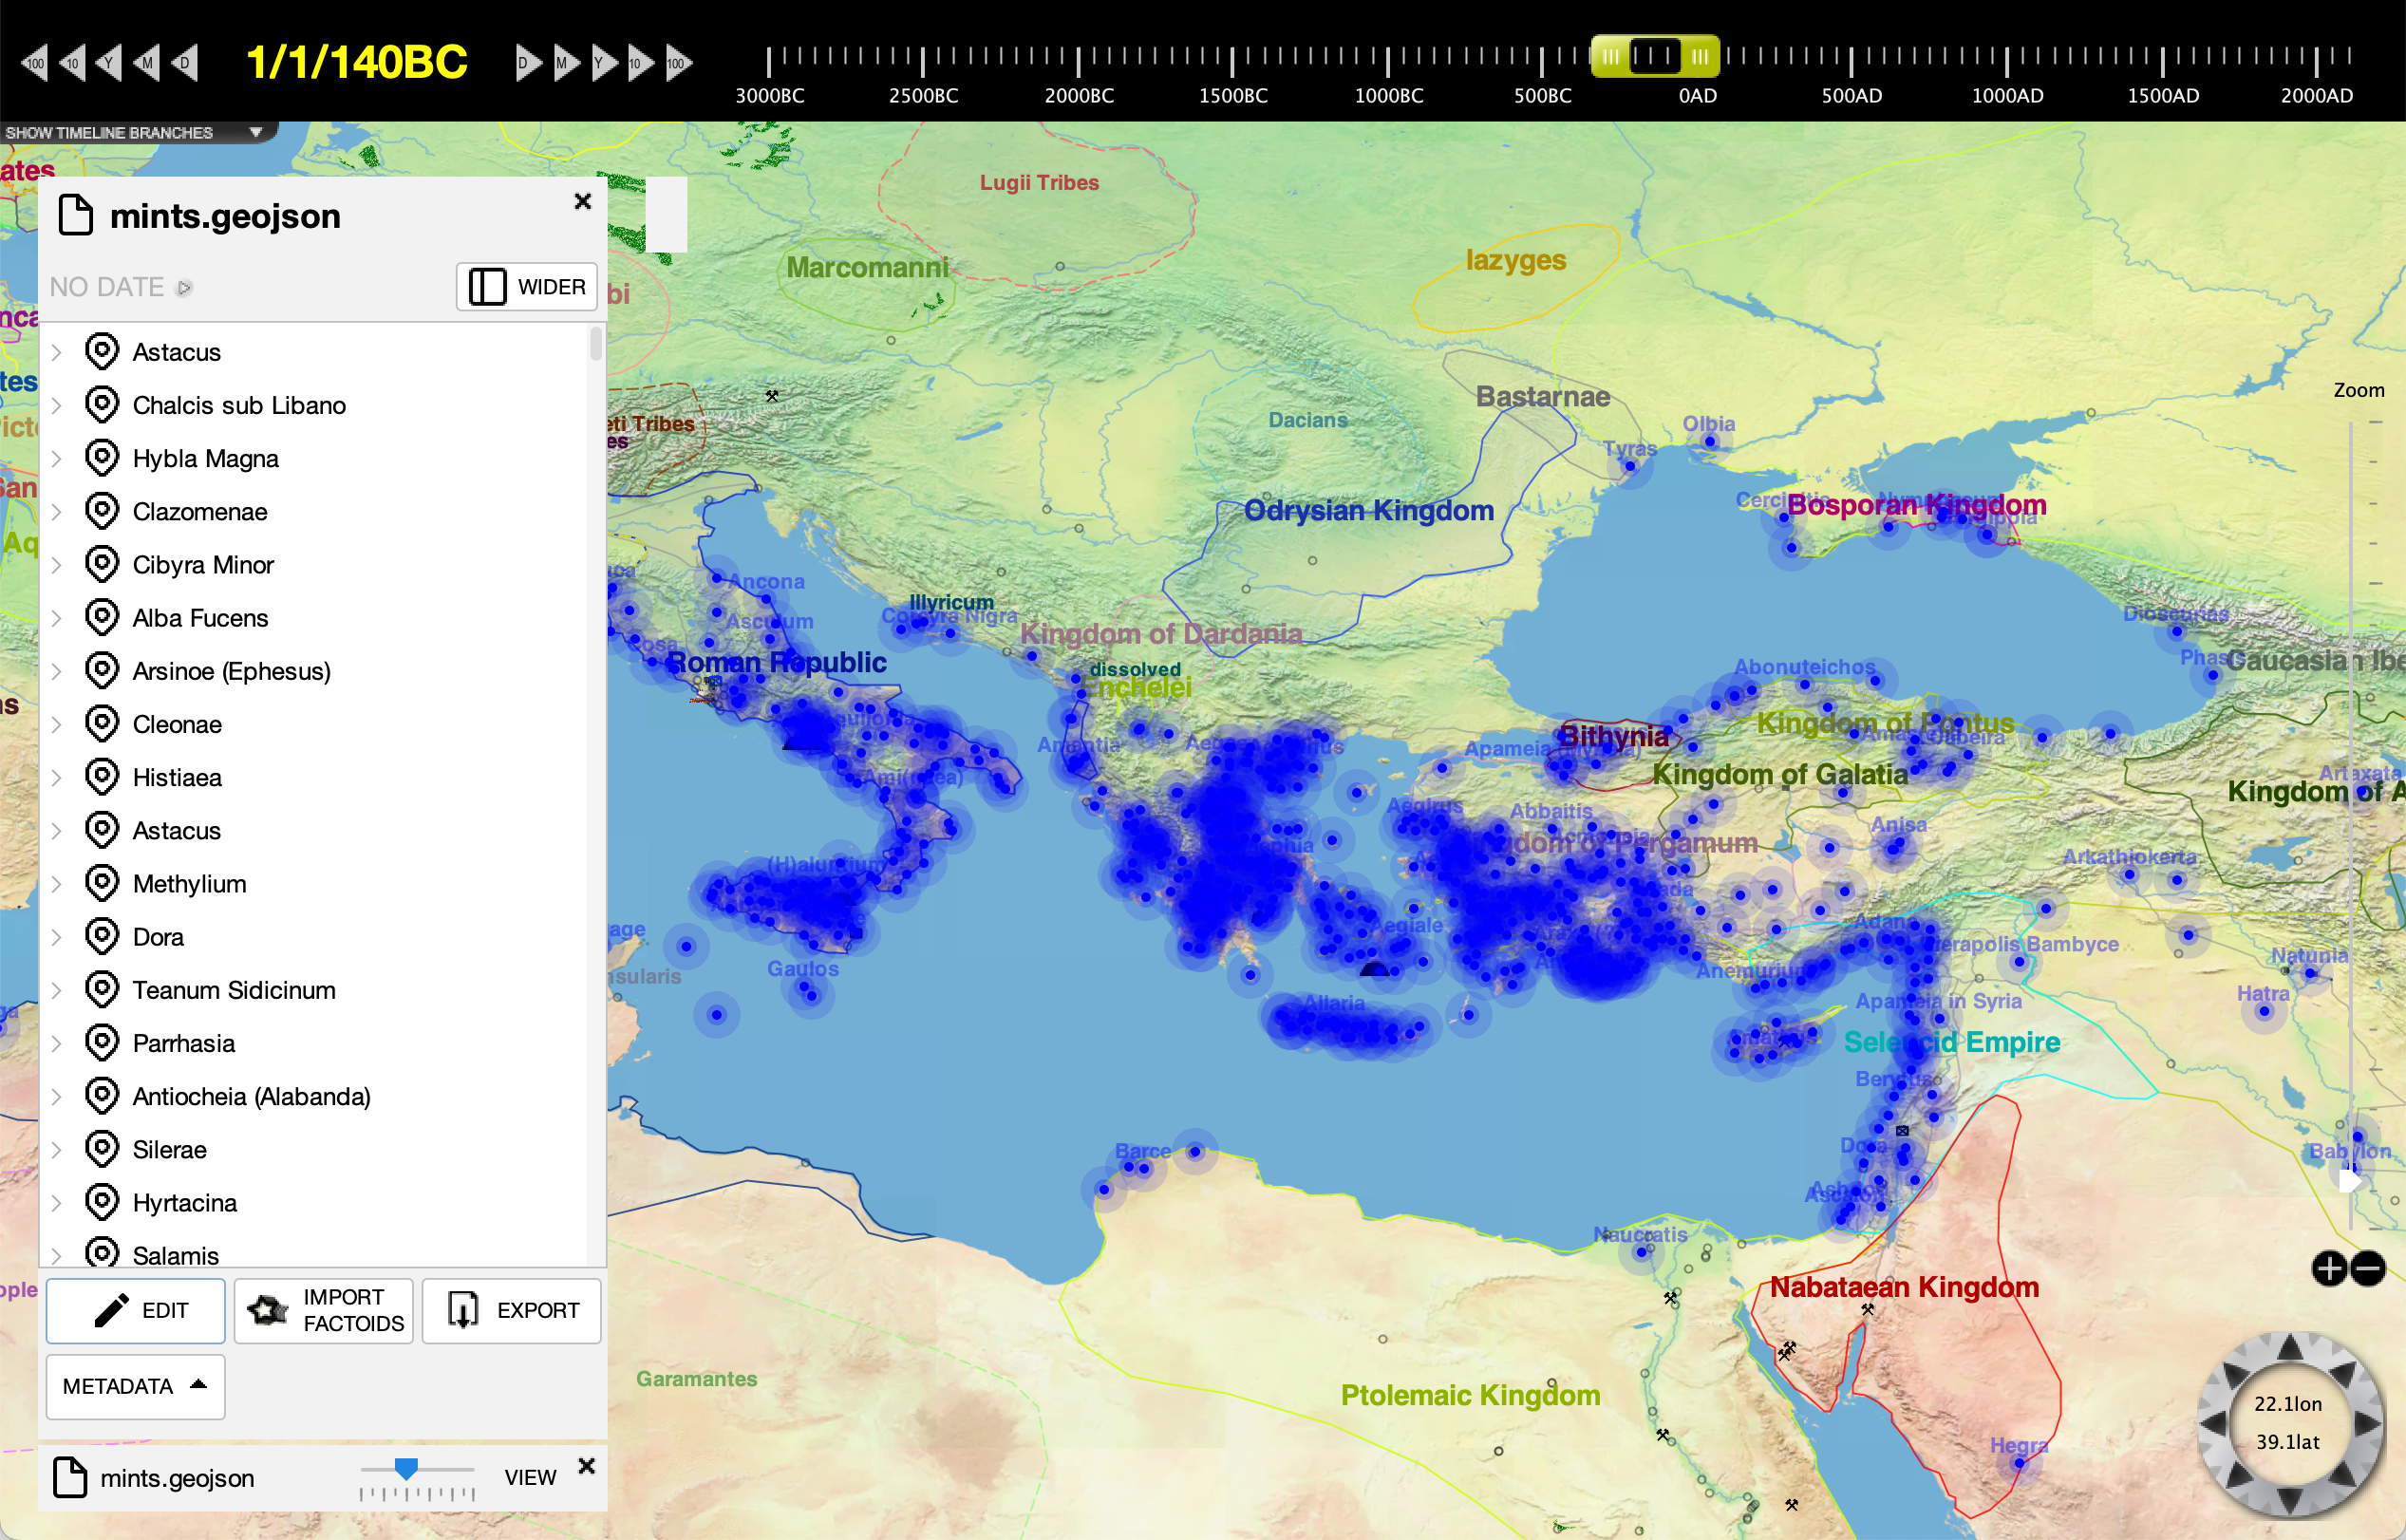
The file will load as a new data source and be visible in the list of data sources at the bottom of the left-side sidebar. The data points for each mint appear as a blue dot in the map. (Note that a GeoJSON file automatically shows as a map layer, but other file types may first require a data layout to identify the location information.) Click "view" or the data source name to view its details.
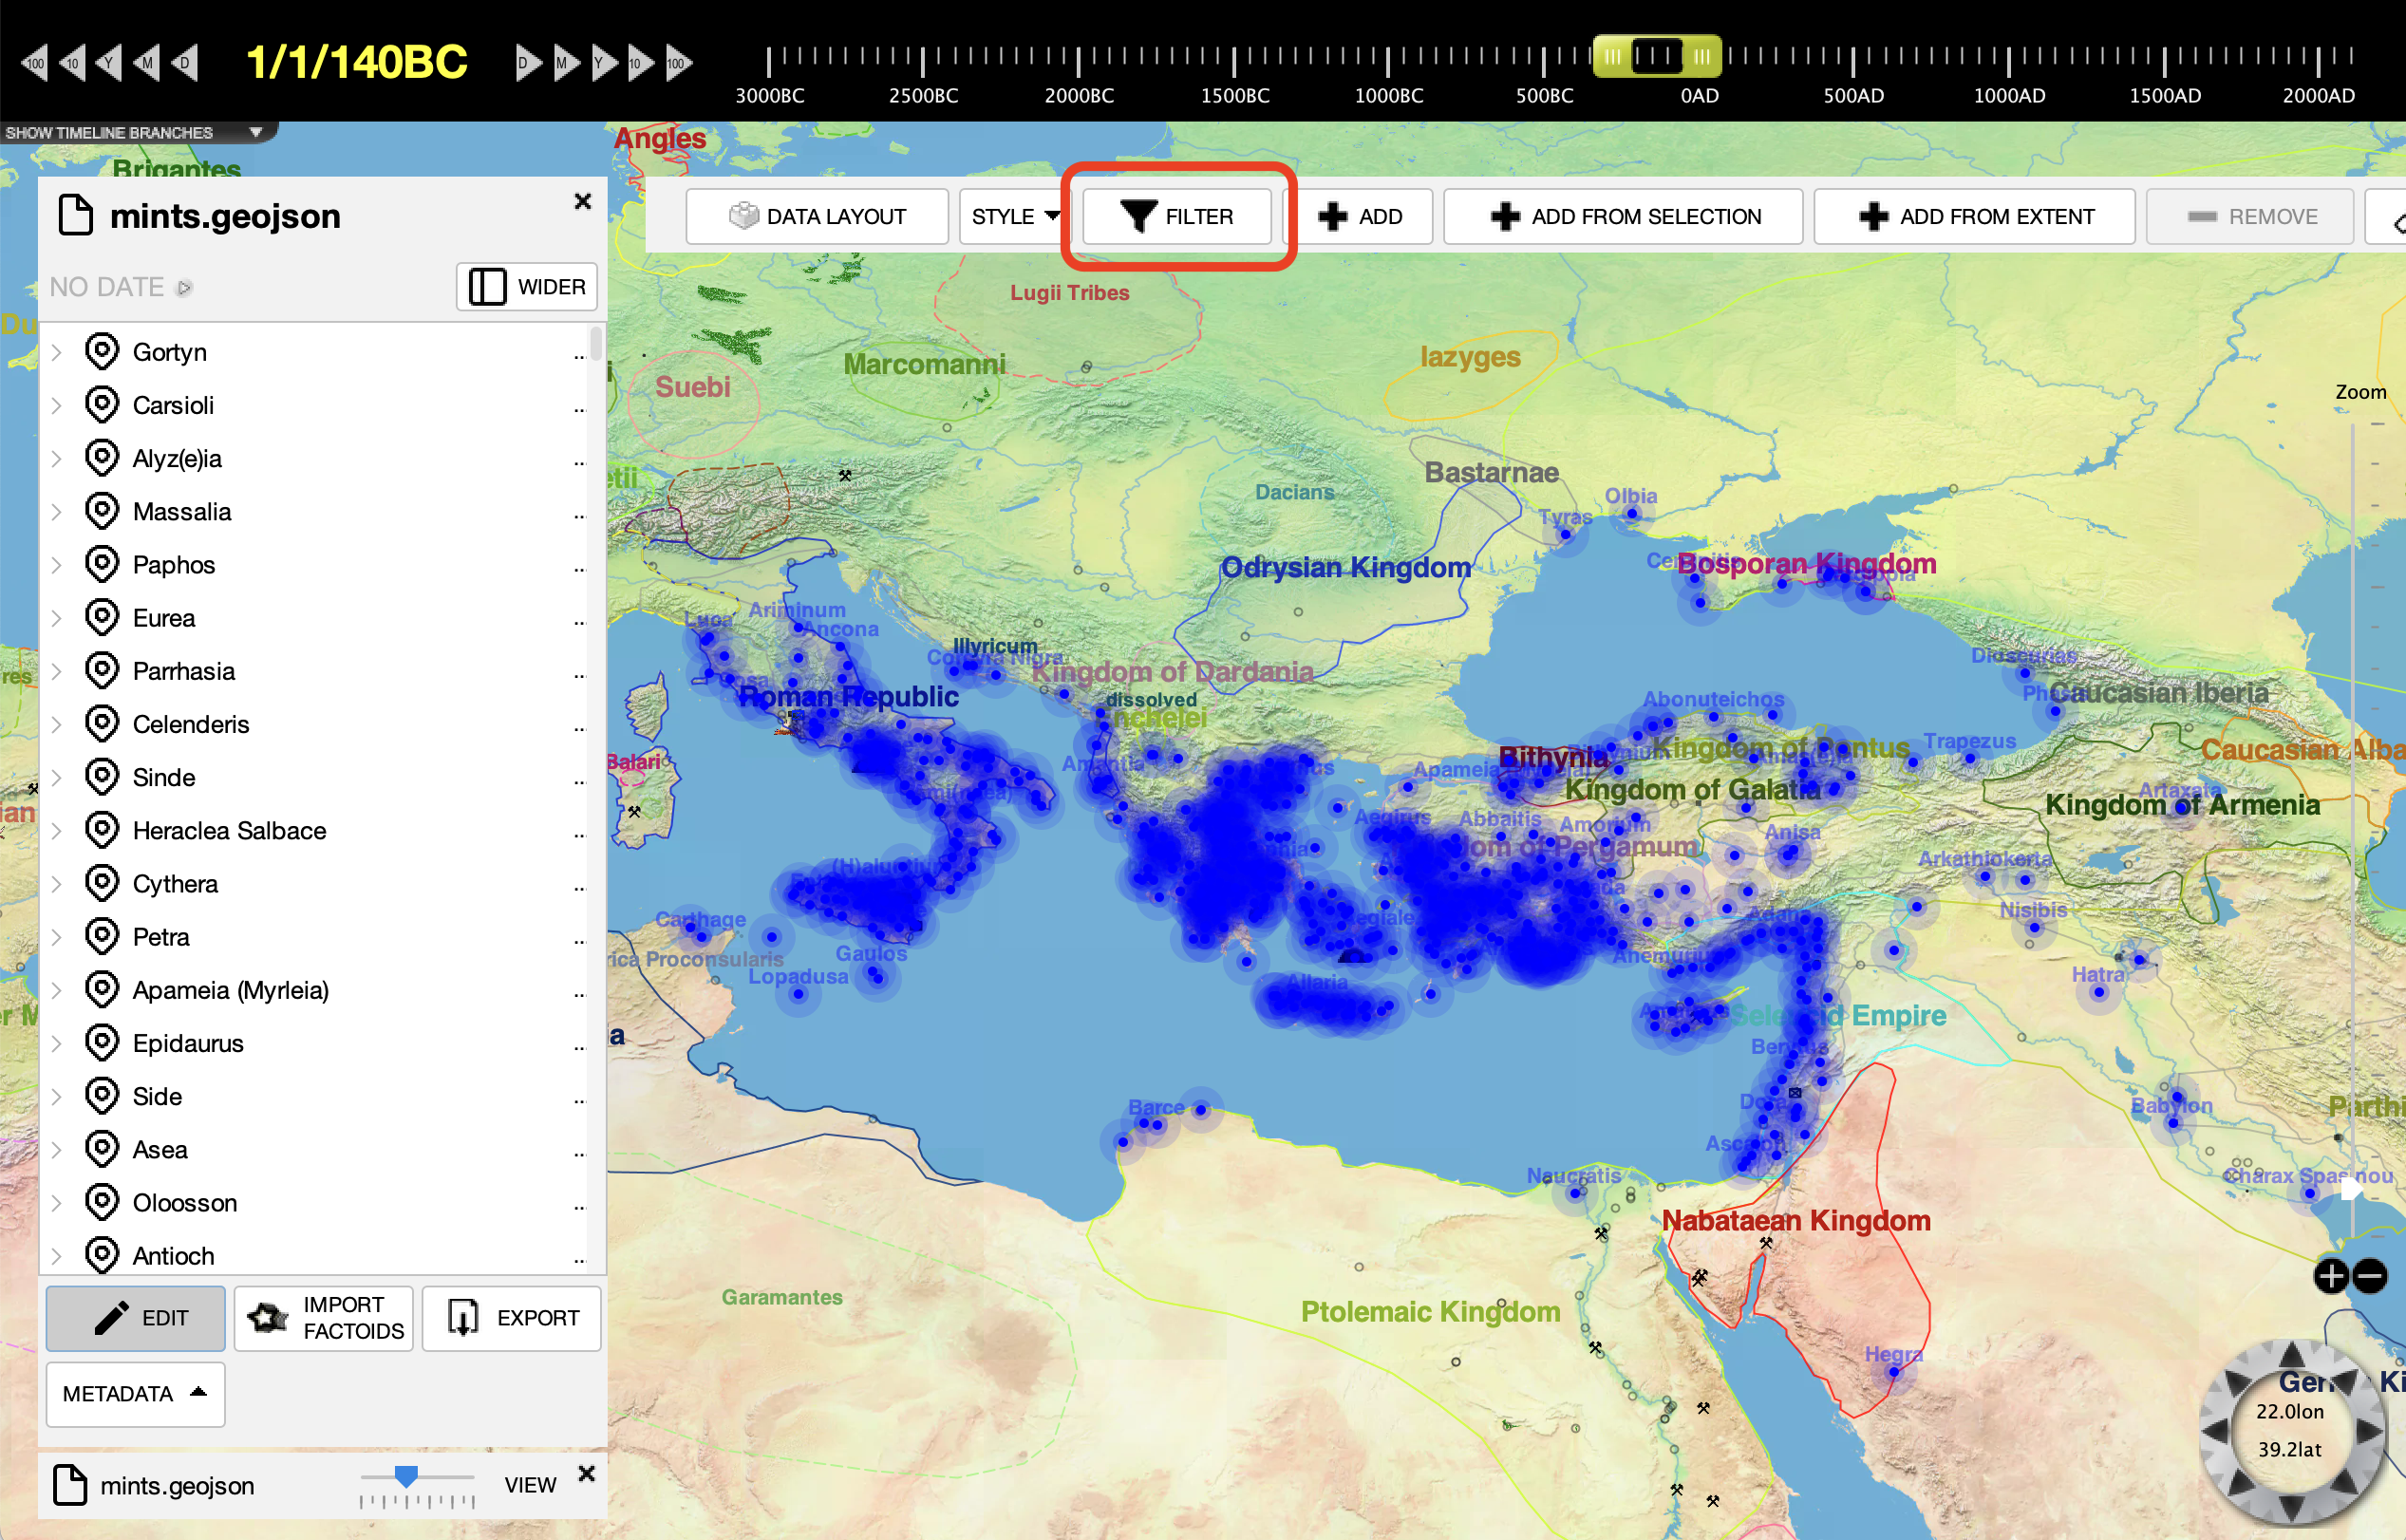
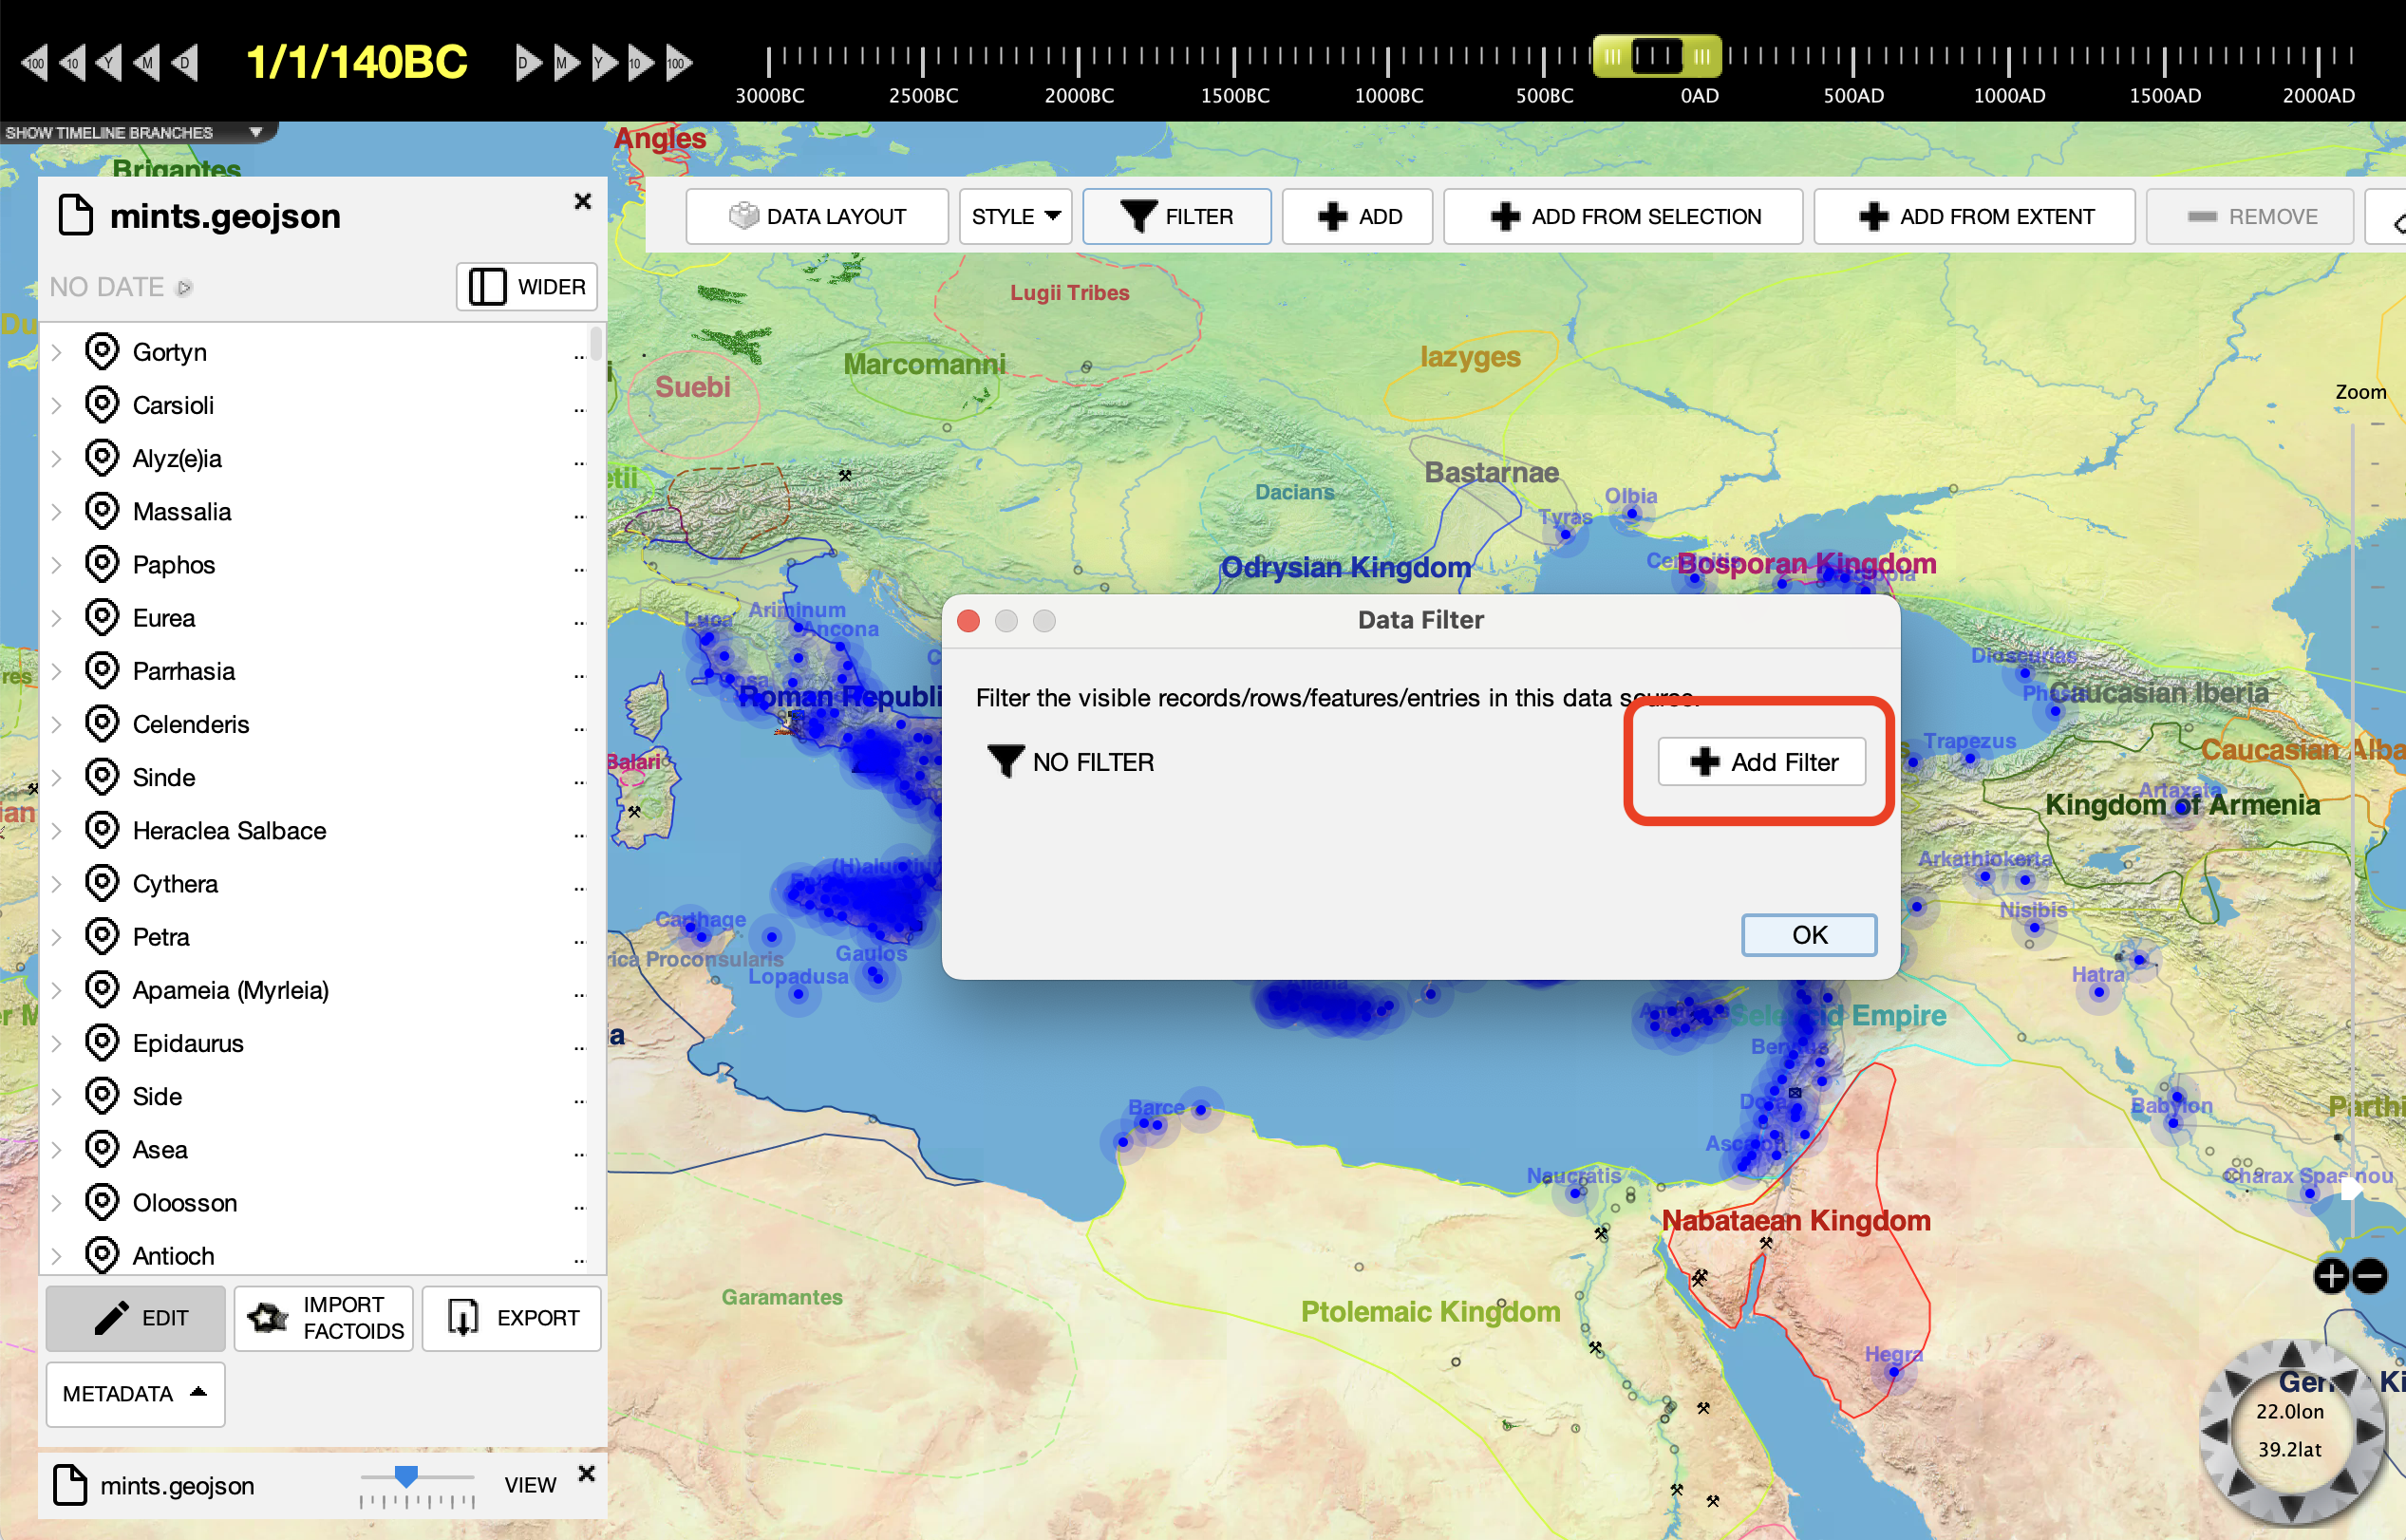
Switch the data source to "edit" mode. We are going to change how it appears, so first we must switch into edit mode. This prevents unanticipated and unintentional changes. Then, from the toolbar, select "filter."
When the filter control comes up, there is initially no filter. Click "add" to add a new filter. Currently, only one filter can be applied.
Change the filter terms from the defaults to the property "name", the criteria "STARTSWITH", and the value "D". This will filter the mints for only those where their name starts with the letter D. This is not a particularly useful filter, but it illustrates the technique. If your GeoJSON file or other file has more properties, then you can filter on those. I.e. if you have a description field you can identify all locations that have "silver coin" mentioned.
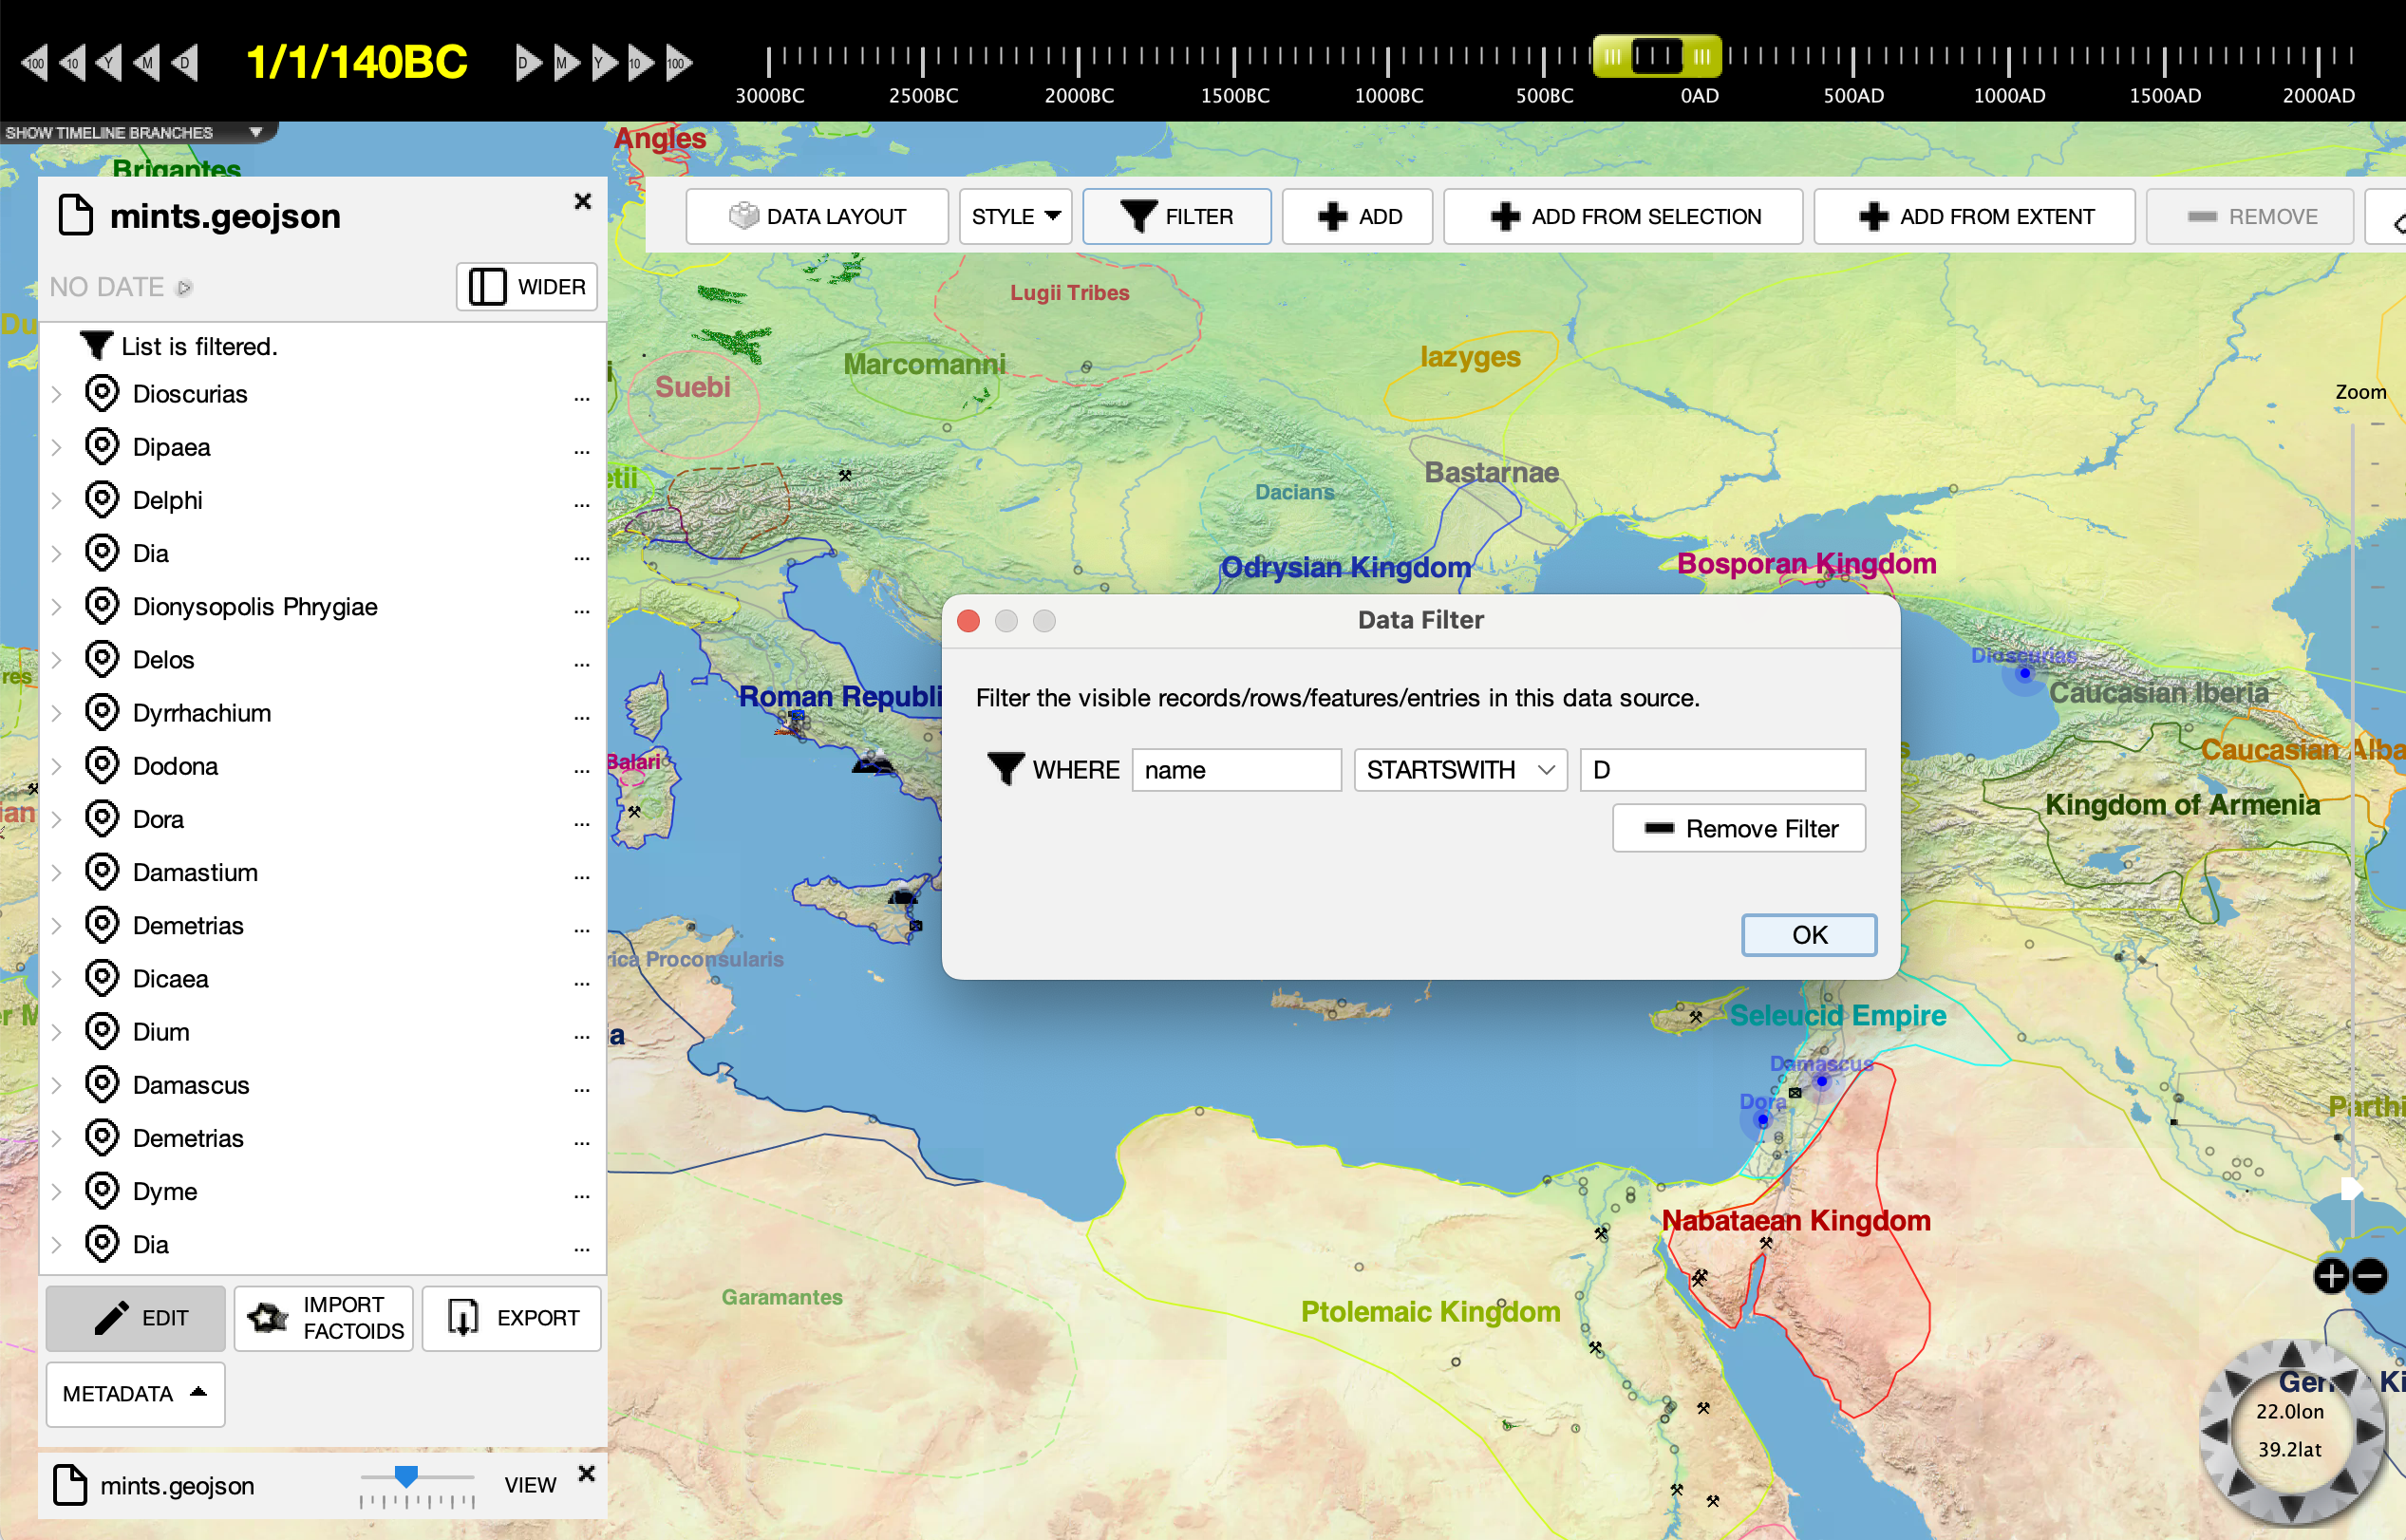
The list of mints shown is now reduced to only those matching the filter criteria. This filters the list shown in the sidebar at left, the points shown in the map layer, and (as we will use in the next section) the data used by other analysis.
Analyzing
Now, we are going to use the filtered data as an input to a simple analysis. We are going to draw a polygon feature around the extent of the filtered data points. Since the filter selected above is all mints where the name begins with the letter D, we will create a polygon of the extent of such mints. A more sophisticated filter would produce a more useful research result than this simple tutorial.
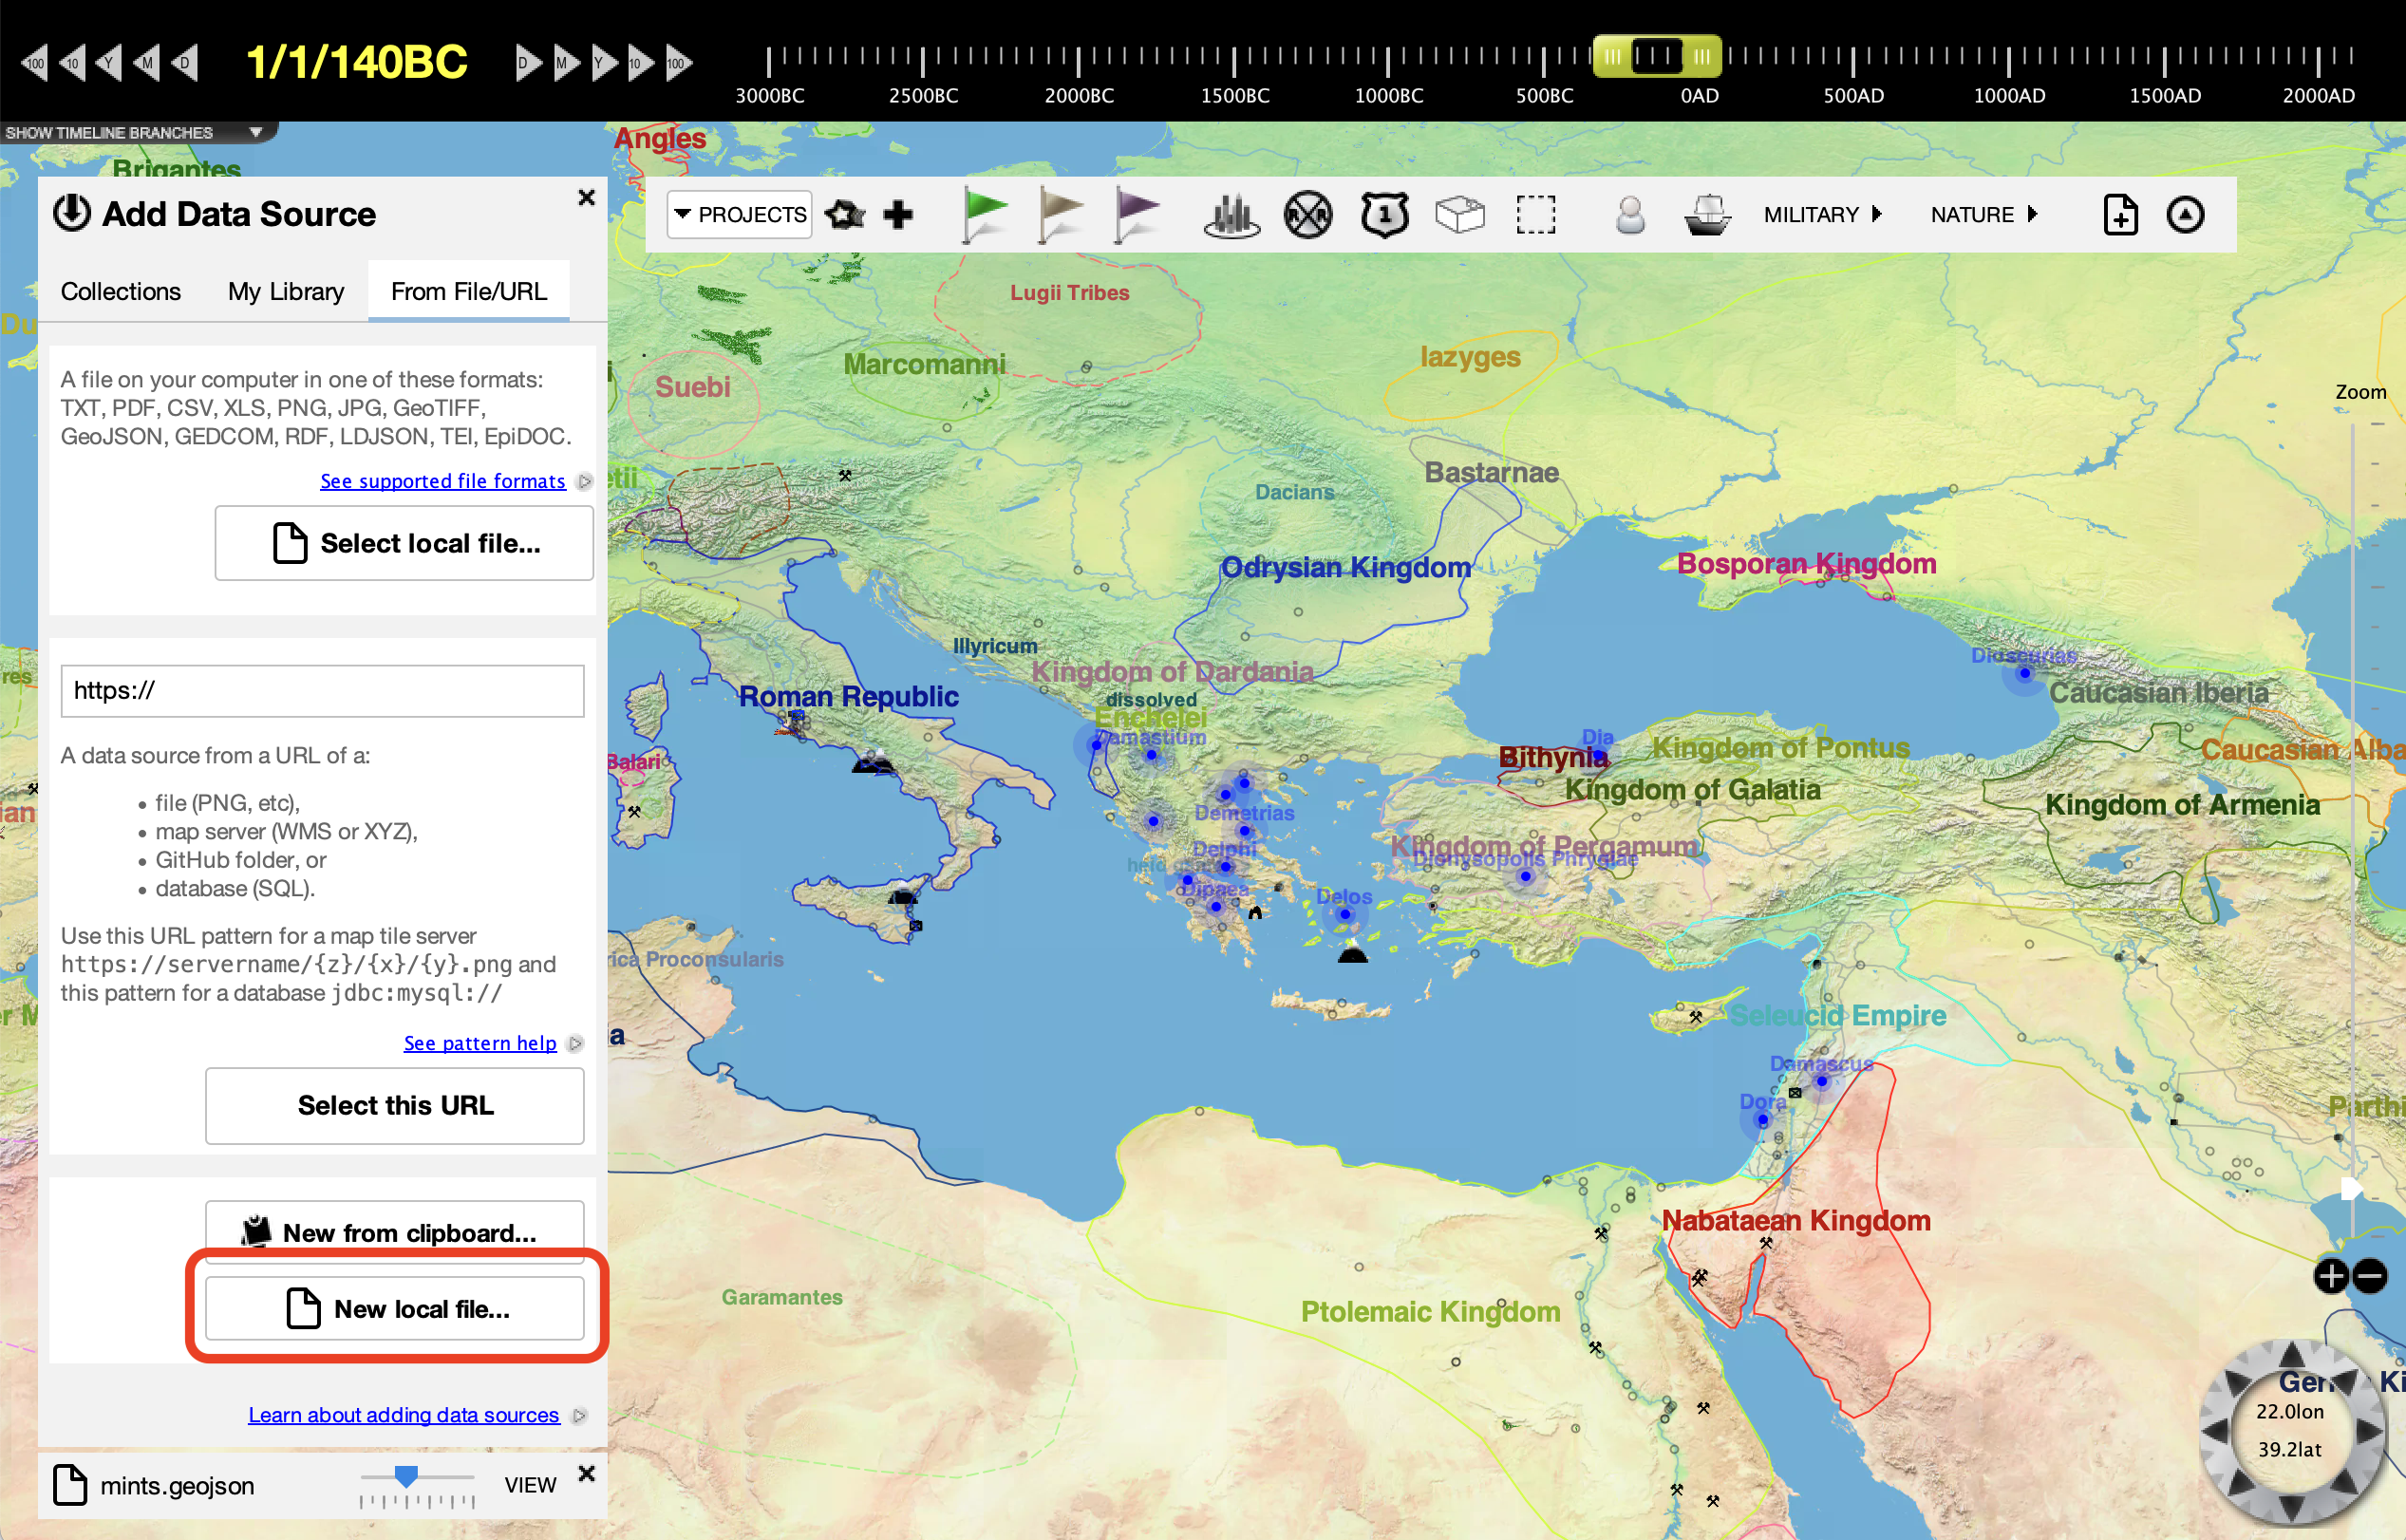
First, we are going to create a new, blank GeoJSON file to store our result. We open the "add data source" panel, but this time select "new local file."
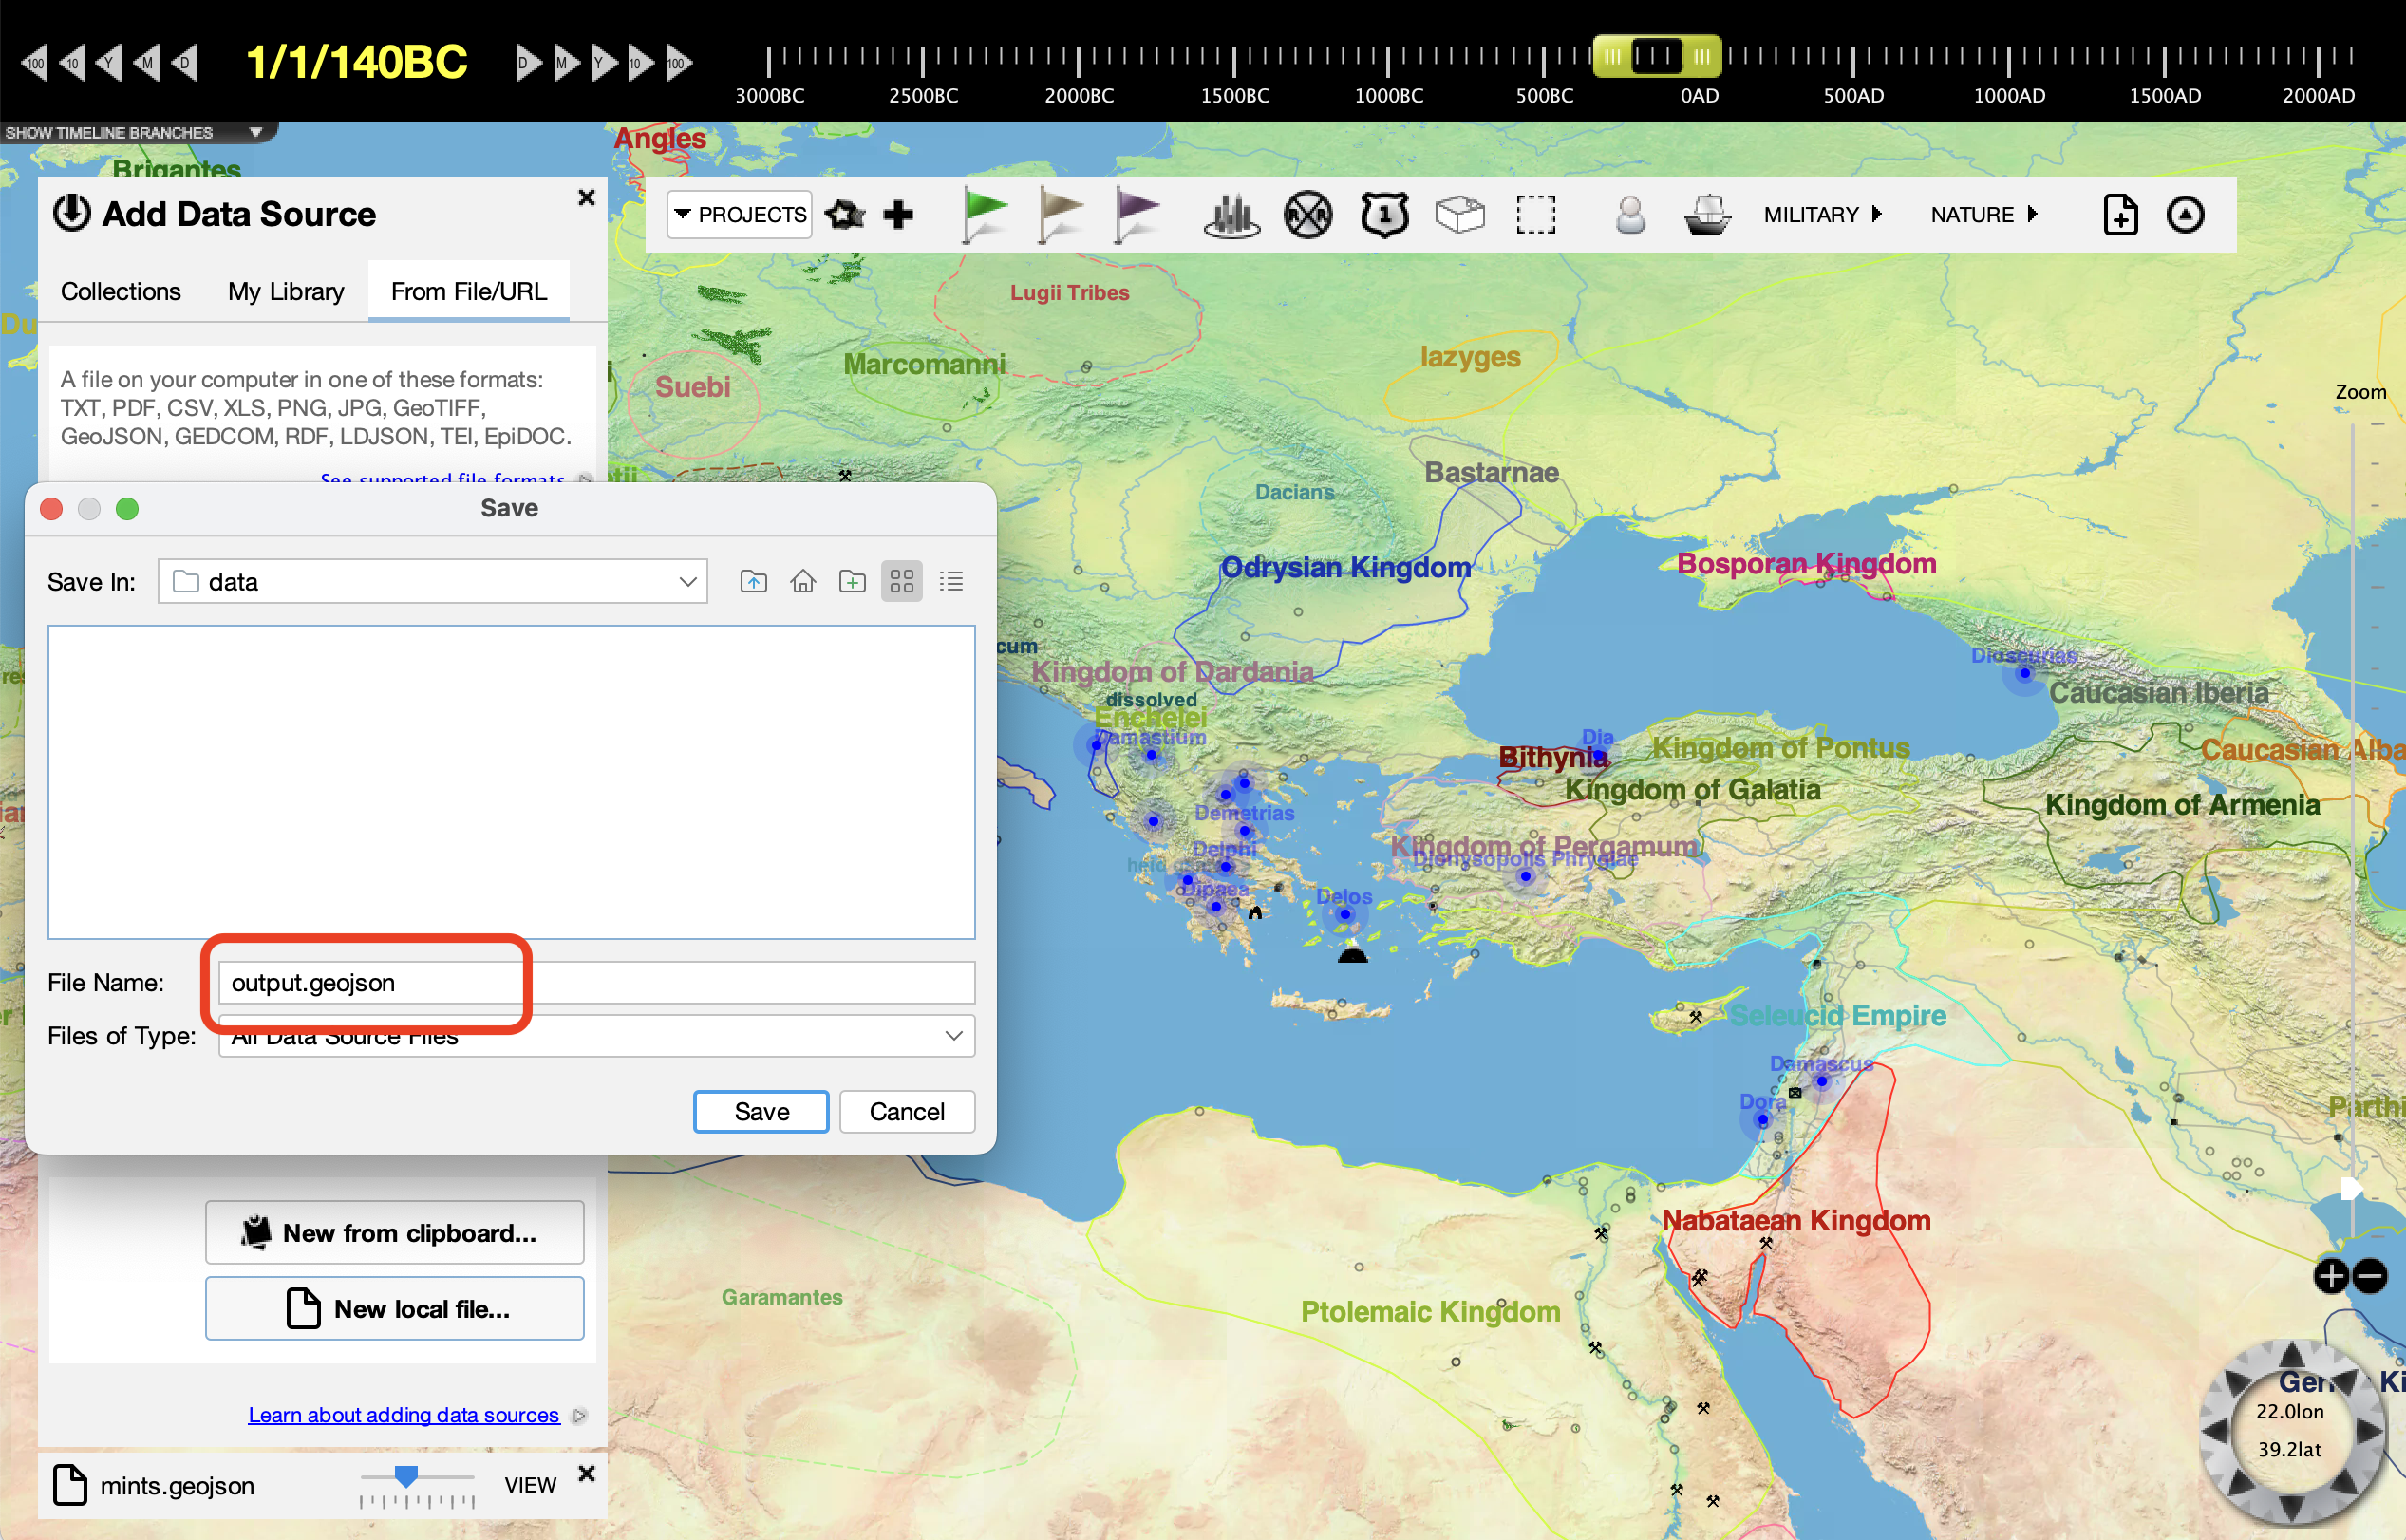
Name the file with the extension .geojson to create it as a new GeoJSON
file that can store polygon features.
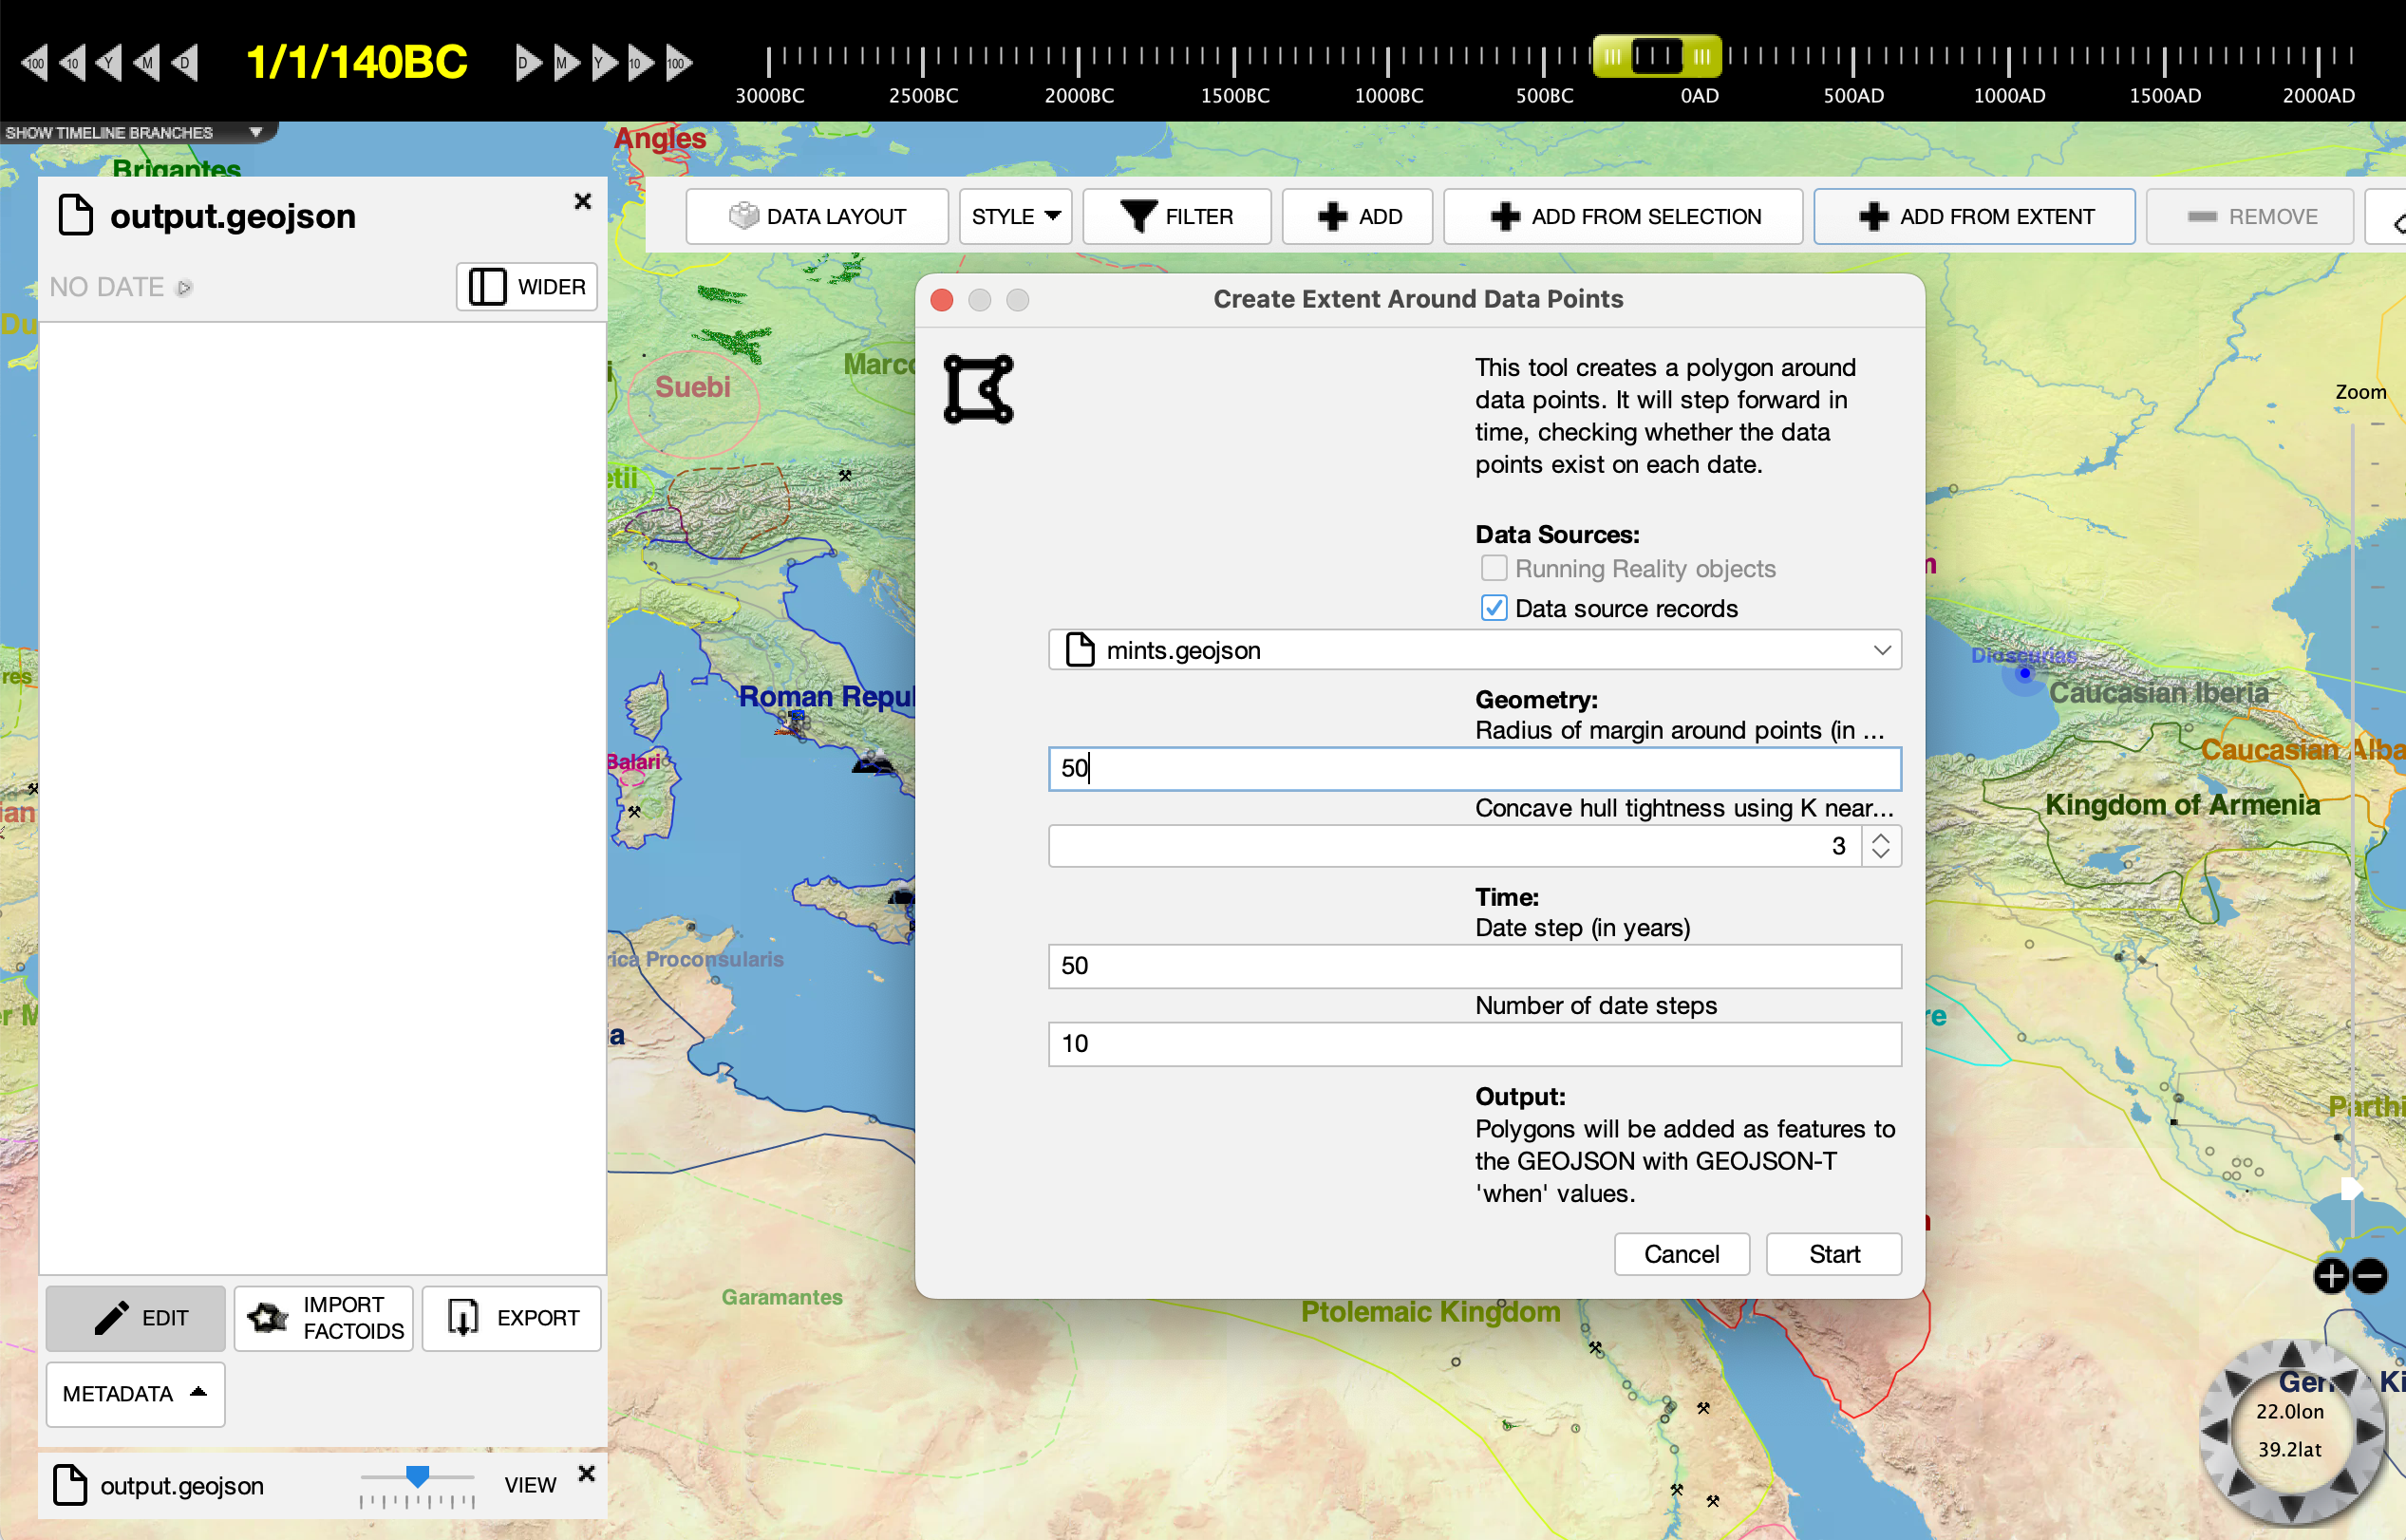
Switch the empty GeoJSON file to "edit" mode, then select "add from extent" to add new polygon features. The "add from extent" adds a series of GeoJSON-T Features with "when" properties.
Select the data source mints.geojson from the list of available sources.
There are other parameters you can set as well. The radius around each point allows you
to mark the extent as being around the points and not exactly at the points. The "k"
parameter increases the number of nearest neighboring points the algorithm will use, which
can mean a tighter extent polygon. The time steps will begin at the time on the app's
main timeline, with step count and step size based on the analysis parameters.
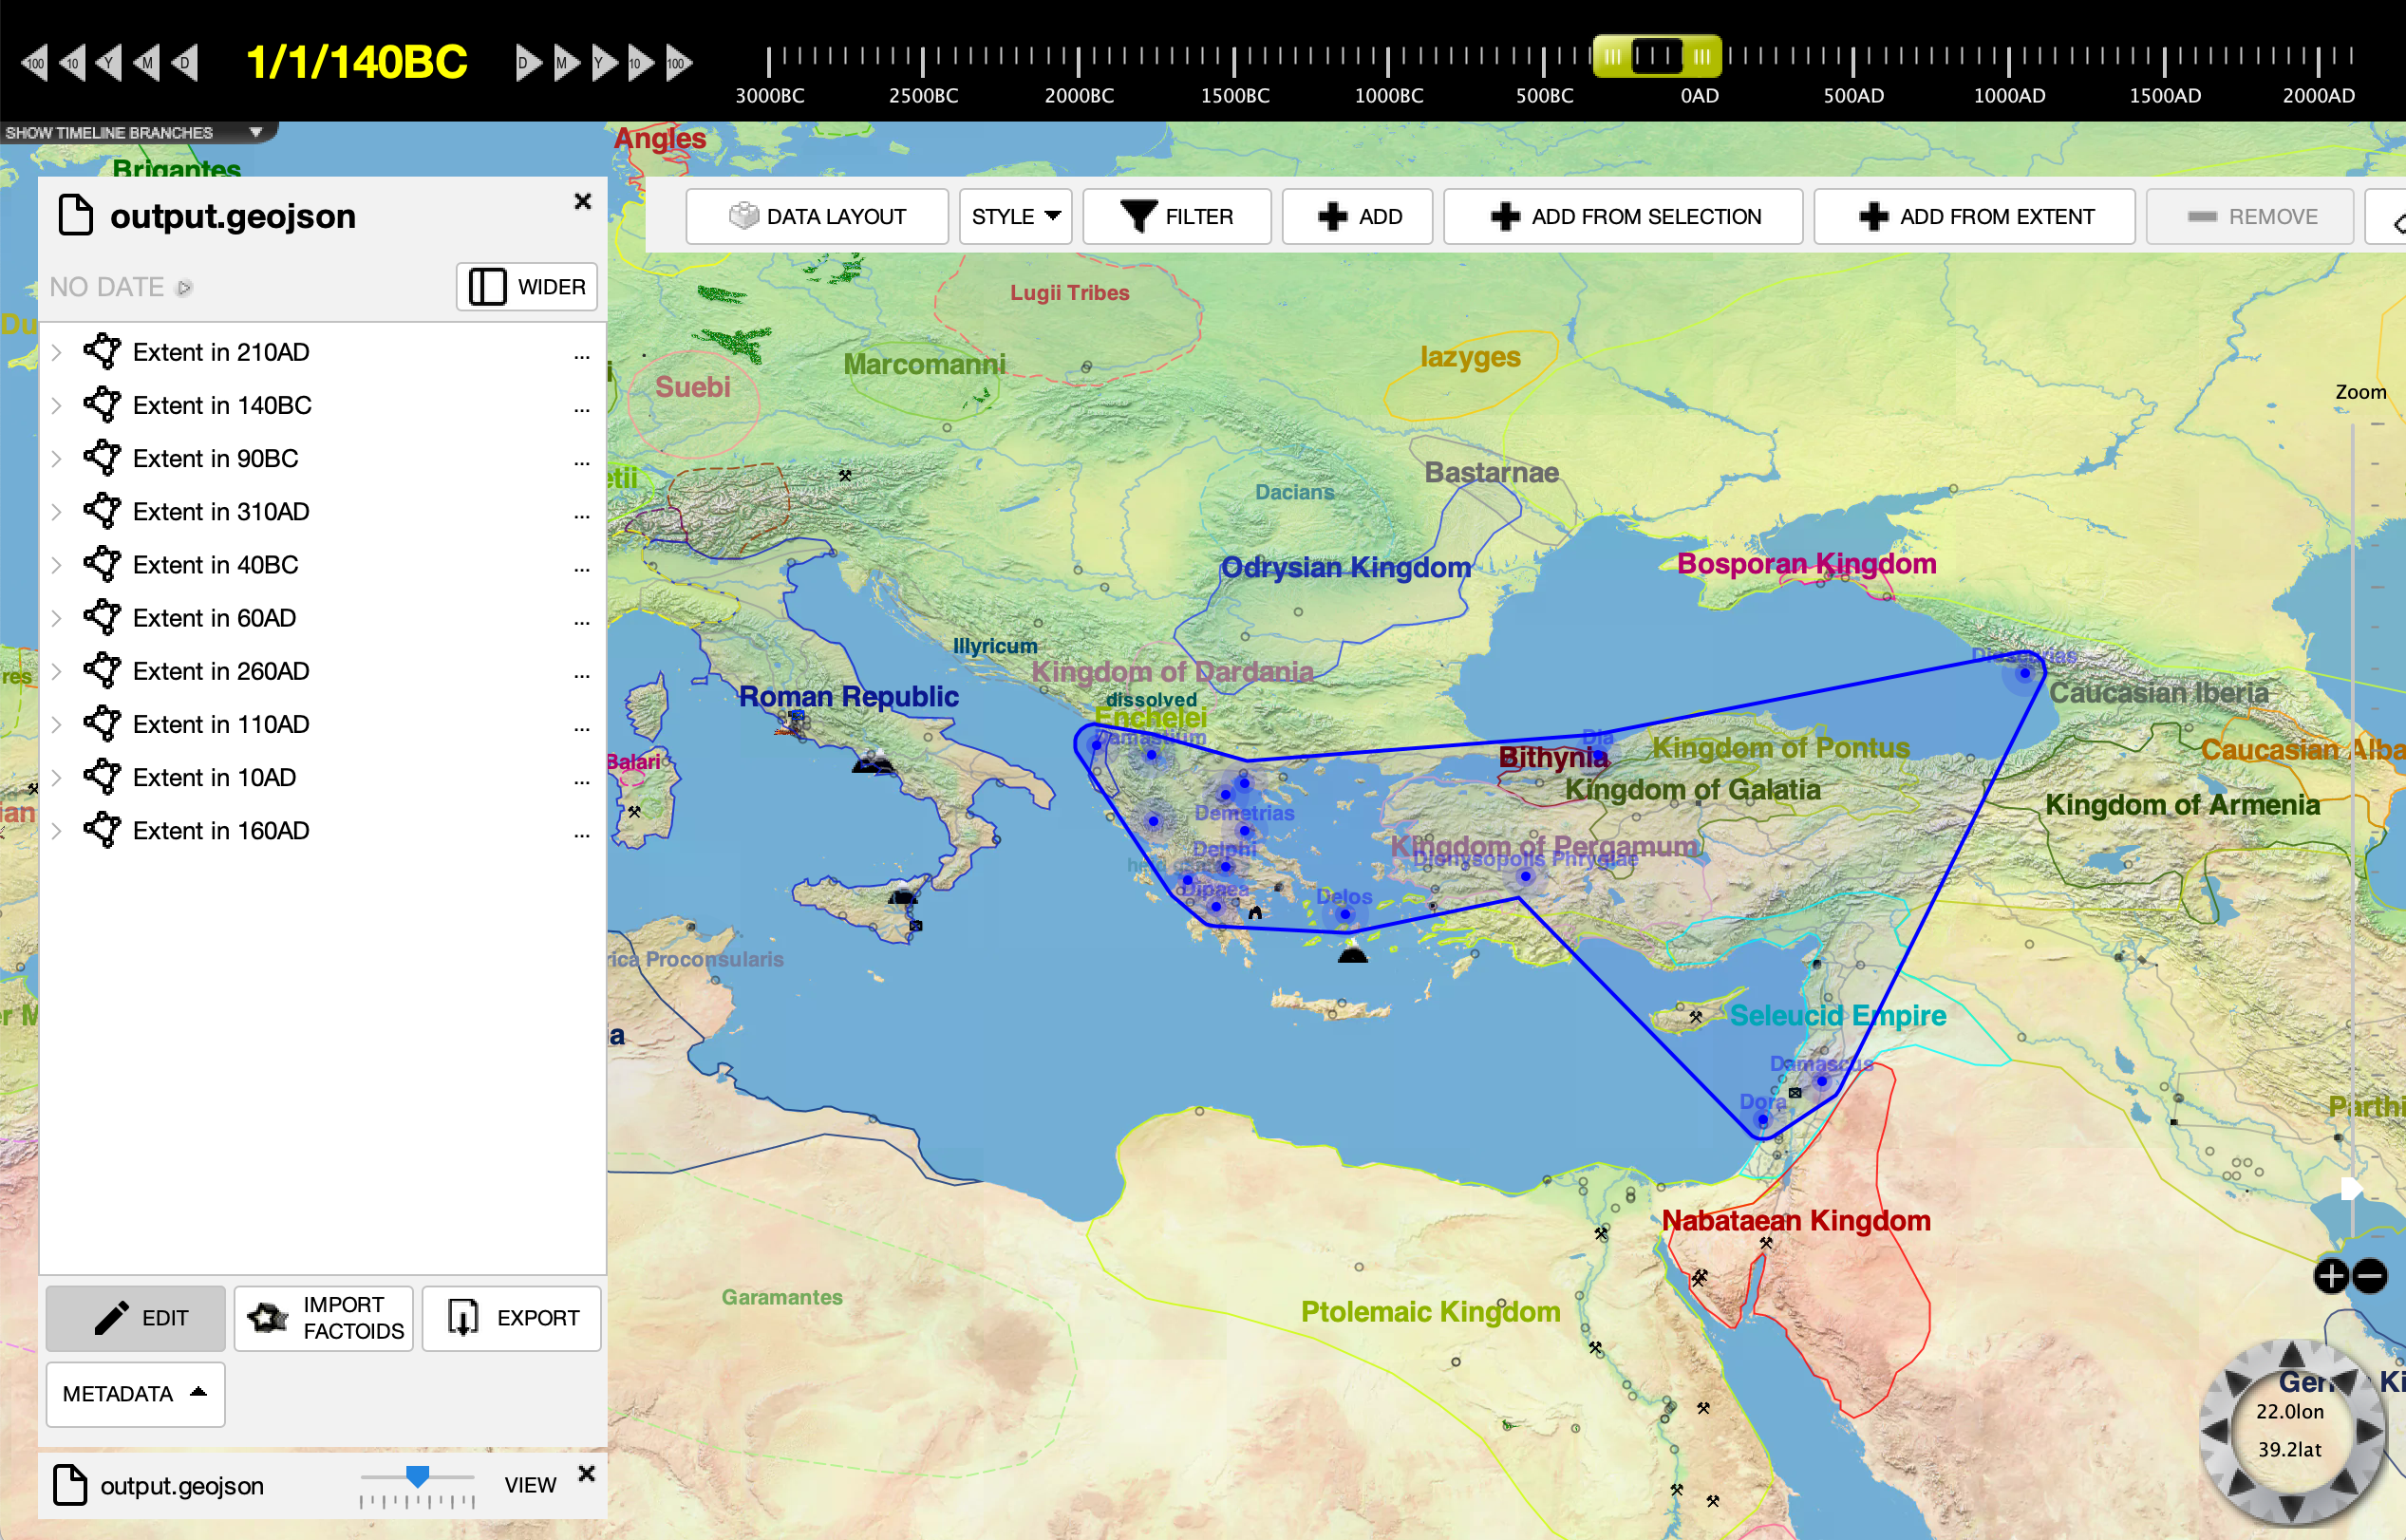
This is the result of the extent analysis. The blue polygon shows the extent of the mints that have names beginning with the letter D. We could then unfilter the original file to see how the filtered extent compares to the main file or to another filter.
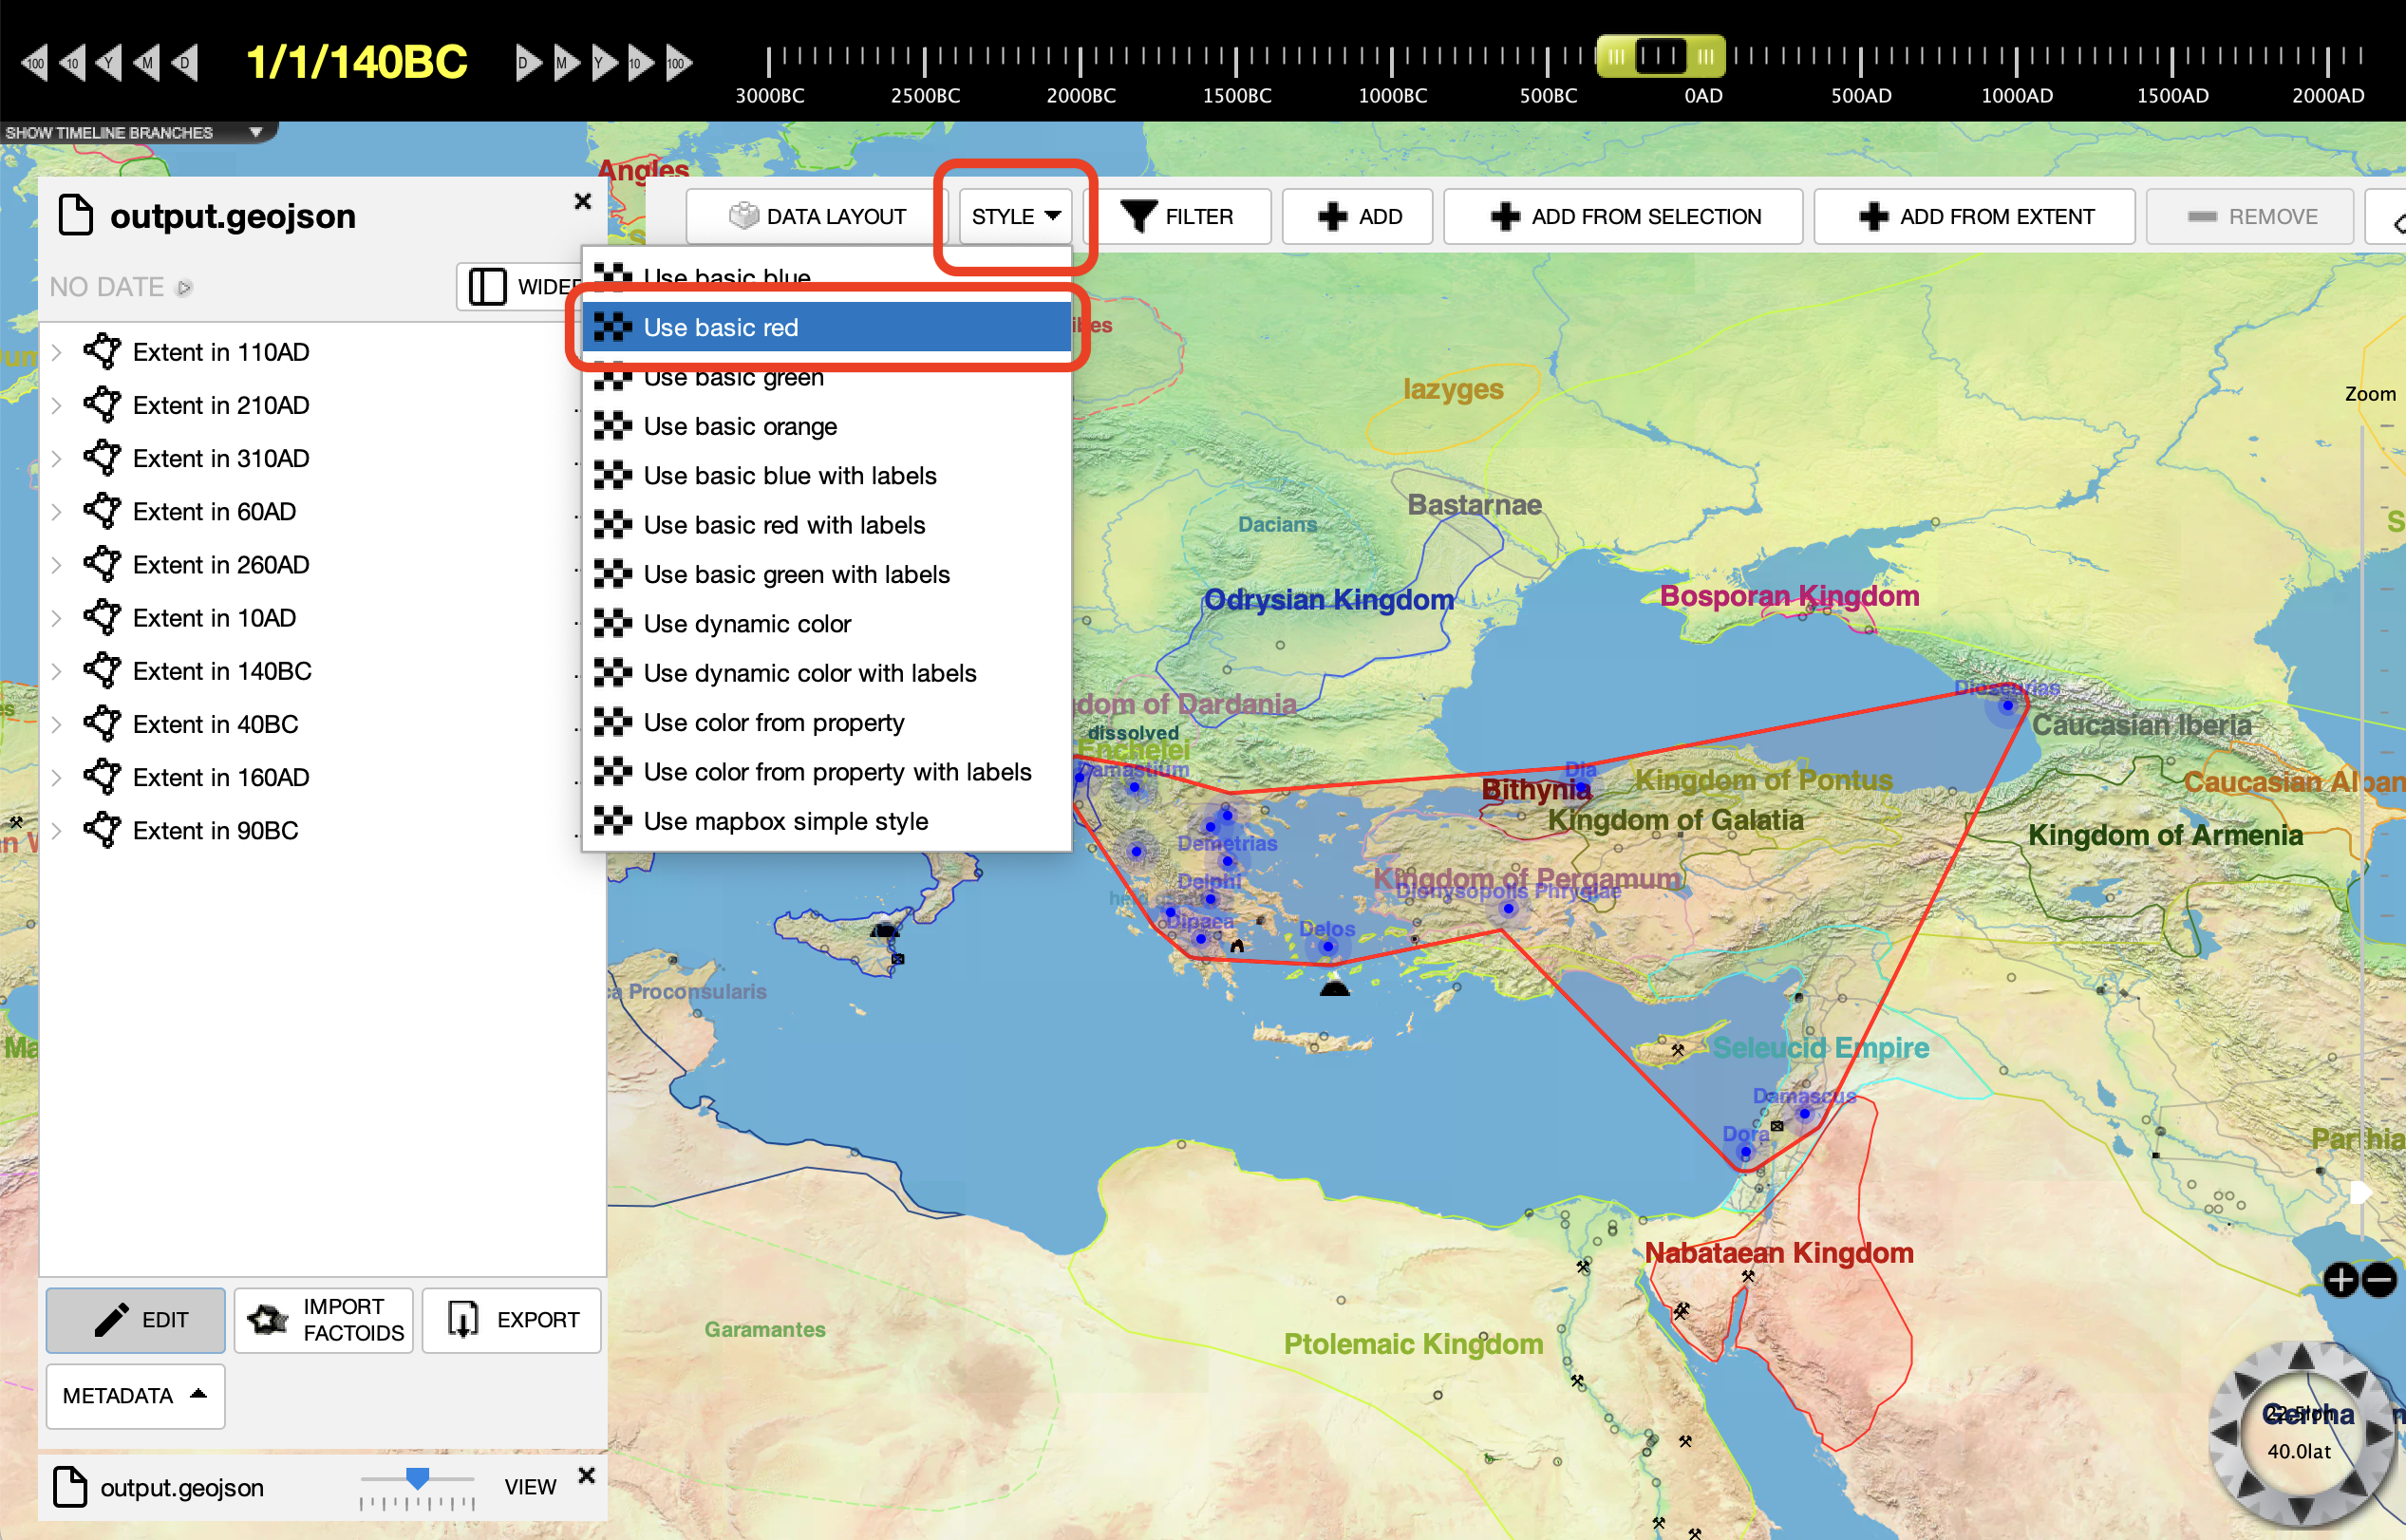
Finally, to make the extent polygon stand out more, we switch the style for this GeoJSON file to show with a simple red color. This provides better contrast between the blue source data and the red analysis. Note that style information is not standardized across GIS apps because there are only conventions for styling GeoJSON, not standards.
The output GeoJSON file is now ready to be used in other GIS apps or uploaded to a website that visualizes GeoJSON layers, such as one using OpenLayers or LeafletJS.
Feedback
If you can not find an answer here, or would like to request a feature, please feel free to ask us for help. Send us an email if you would like us to get back to you with a response: